


Introduction
Lung cancer is a leading cause of cancer-related mortality in the world and non-small cell lung cancer (NSCLC) accounts for approximately 85% of lung cancers [1]. Tumor tissue consists of tumor cells, immune cells, and stromal cells such as fibroblasts and endothelial cells [2]. As a result of high infiltration by immune and stromal cells, NSCLC has a relatively low level of tumor cell purity compared to other tumors [3]. The interactions between tumor cells and tumor microenvironment (TME) trigger cancer metastasis and progression [4].
Cancer-associated fibroblasts (CAFs) are key components of the TME that influence matrix deposition and remodeling through their interactions with infiltrating immune cells and malignant cancer cells [5]. CAFs secrete cytokines, chemokines, and growth factors, confer chemoresistance and promote cancer progression and metastasis [6]. The prognostic significance of CAFs in breast and lung cancers has been reported previously [7].
Successful immunotherapy for cancers requires effective infiltration of CD8+ T cells inside the tumor, and tumors containing CAFs often have low levels of tumor-infiltrating lymphocytes (TILs) [8,9]. CAFs also promote immune suppression thorough their interactions with M2-like tumor-associated macrophages or myeloid-derived suppressor cells [10-12]. Although CAFs regulate immunosuppression via their effects on TILs in TME, the interactions between T cells and CAFs in NSCLC remain unclear.
Cyclooxygenase (COX) has two isoforms: COX1 and COX2. COX1 maintains tissue homeostasis and is expressed in a variety of tissues. COX2-derived prostaglandin E2 (PGE2) facilitates the neointimal hyperplasia response to injury [13]. COX2 is also highly expressed in solid tumors such as colorectal, pancreatic, and lung cancers [14-16]. The pro-inflammatory enzyme COX2 and its downstream pathway product PGE2 promote immunosuppression, carcinogenesis, and tumor progression [17,18]. COX2 expression is associated with programmed death-ligand 1 (PD-L1) expression in NSCLC and breast cancer [19,20]. Therefore, COX2 inhibitors may be used as an adjuvant strategy for targeting caners.
In the present study, we investigated the effects of CAFs on the immune function of CD4+ and CD8+ T cells, and evaluated the role of COX2 in immune evasion in NSCLC.
Materials and Methods
1. Patients and samples
Lung tumor tissues were obtained from patients who underwent surgery or endobronchial ultrasound-guided transbronchial needle aspiration at Samsung Medical Center, Seoul, South Korea. Peripheral venous blood was collected from patients and healthy donors. The study protocol was approved by the Institutional Review Board of Samsung Medical Center (IRB no.: 2014-03-140) and all participants provided informed consent.
2. Cell isolation and culture of CAFs and normal fibroblasts
CAFs were isolated from tumor tissue, whereas normal fibroblasts (NFs) were isolated from the most distant non-tumor tissue from the resected lungs of NSCLC patients. The non-tumor and tumor specimens were washed three times with phosphate-buffered saline (PBS; Hyclone, Logan, UT, USA). Tissue specimens were minced into 1 to 2-mm3-sized pieces and digested using 1 mL of 0.25% collagenase type I (Stemcell Technologies, Vancouver, Canada) at 37┬░C in an incubator for 30 minutes to 1 hour until single cells were >70%. After enzyme digestion, samples were centrifuged at 1,300 rpm for 3 minutes. The pellets were resuspended in DulbeccoŌĆÖs Modified Essential Medium (DMEM)/F12 (Gibco, Invitrogen, Carlsbad, CA, USA), 10% fetal bovine serum (FBS; Gibco), and 1% antibiotic-antimycotic solution (Gibco). Next, the pellets were placed in 100-mm dishes. The cells were expanded for 7 to 14 days until they reached 90% confluence. The cells which migrated from seeded tissue fragments were collected after trypsin-ethylenediaminetetraacetic acid (EDTA; Gibco) treatment. The cells were passed through a 100 ┬Ąm strainer (Falcon, Franklin Lakes, NJ, USA), and the collected cells were spread out on a 100-mm dish. Next, the cells were expanded to passage 3 and cryopreserved in complete DMEM with 10% dimethyl sulfoxide (Sigma-Aldrich, St. Louis, MO, USA) until analysis. CAFs were validated by negative expression of epithelial cell adhesion molecule (EpCAM) or E-cadherin by flow cytometry or real time-polymerase chain reaction (RT-PCR). Peripheral blood mononuclear cells (PBMCs) were isolated from buffy coats obtained from patients and healthy donors using Ficoll-Paque Plus (GE Healthcare Biosciences, Piscataway, NJ, USA).
3. Co-cultures of CAFs/PBMCs and proliferation assays
PBMCs were labeled with 1 ┬ĄM carboxyfluorescein succinimidyl ester (CFSE; Invitrogen) in PBS and at 37┬░C for 15 minutes. Next, the cells were washed three times with PBS containing 5% inactivated FBS. After washing, the cells were plated in a 24-well plate (1├Ś106) at a 1:10 ratio (1 CAF per 10 PBMCs) in the absence or presence of CAFs. The cell culture medium included DMEM/F12 supplemented with 10% FBS and 1% antibiotic-antimycotic solution. PBMCs were stimulated or left unstimulated with an anti-human CD3 antibody (OKT3; 15 ng/mL; Biolegend, San Diego, CA, USA). After 5 days, the PBMCs were harvested for flow cytometry. Most proliferation assays were performed using allogeneic PBMCs, whereas some experiments were performed using CAFs and PBMCs derived from the same patients (autologous pairs). Direct and indirect co-culture of CAFs and PBMCs was performed to evaluate the effect of direct cell-to-cell contact. To prevent contact between PBMCs and fibroblasts during indirect co-culture, a 24-well Transwell system (membrane with 0.4 ╬╝m pores; Falcon) was used; PBMCs were added to the upper chamber and fibroblasts were added to the lower chamber. After 5 days, PBMCs were analyzed by flow cytometry.
4. Preparation of CAF conditioned medium
CAFs were seeded on 100 mm dishes at 1├Ś106 cells/mL with CAF culture medium (DMEM/F12 containing 10% FBS and 1% A/A). Two days after cell seeding, CAF culture medium was removed and 10 mL of serum-free CAF culture medium was added. After 2 days of incubation, the supernatant was collected and filtered with a 0.2 ╬╝m membrane (25AS020AS, Advantec, Neihu District, Taiwan) for sterilization. CAF conditioned medium (CAF-CM) were stored at 4┬░C until use.
5. Co-culture of patient-derived tumor organoids/PBMCs and tumor organoid killing assay
To investigate the influence of CAF-CM on the cytotoxicity of T cells, we performed a co-culture experiment using the autologous pair of patient-derived tumor organoids (PDOs) and PBMCs and a tumor organoid killing assay. Briefly, PDOs and PBMCs thawed in a 37┬░C water bath by gently swirling the vials. The cells were then immediately transferred to a large volume of prewarmed media. After centrifugation, PDOs and PBMCs were mixed in a 1:2 ratio. Subsequently, the mixture of PDOs and PBMCs were resuspended in 20 ╬╝L of 60% Cultrex reduced growth factor basement membrane extract type II (3533-010-02; Trevigen, Gaithersburg, MD, USA) and dispensed into ultralow-attachment 96-well plates (Corning, Glendale, AZ, USA) in triplicate. After solidifying the drops at 37┬░C for 15 minutes, the mixture of cells were co-cultured in organoid culture medium (advanced DMEM/F12 [Gibco], GlutaMax [Gibco], 100 ng/mL Noggin [Peprotech, Cranbury, NJ, USA], 10% R-spondin-1 conditioned medium, 1x B27 supplement [Gibco], 1.25 mM N-acetylcysteine [Sigma-Aldrich], 10 mM nicotinamide [Sigma-Aldrich], 25 ng/mL human recombinant FGF-7 [Peprotech], 100 ng/mL human recombinant FGF-10 [Peprotech], 500 nM A83-01 [Tocris, Bristol, UK], 3 ╬╝M CHIR99021 [4423, Tocris], and 5 mM Y-27632 [Enzo, Farmingdale, NY, USA]) containing immune check point inhibitors (ICPIs) or control antibody (pembrolizumab [A2002, Selleckchem, Houston, TX, USA], atezolizumab [A2004, Selleckchem], nivolumab [A2005, Selleckchem], or human immunoglobulin G4 isotype control [403701, Biolegend]) in the presence or absence of 50% CAF-CM for 7 days. After 7 days of incubation period, the killing of tumor organoids by autologous T cells was assessed by CellTiter-Glo 3D Cell Viability Assay (G968B; Promega, Madison, WI, USA). The half of the culture media (100 ╬╝L) was removed from individual wells and 100 ╬╝L of CellTiter-Glo 3D Reagent was added to it. After 30 minutes of incubation at room temperature on a shaker, supernatant in each well was transferred to a White Polystyrene 96-well Assay Plate (3912, Corning) and was analyzed with a Veritas Microplate Luminometer (Turner Biosystems, Sunnyvale, CA, USA). The organoid images were acquired with the Eclipse Ti2 microscope (NIKON Eclipse Ti2, Nikon, Tokyo, Japan) using a ├Ś20 objective lens before cell viability assay at day 7.
6. Flow cytometry
Cells were washed and blocked with fluorescence-activated cell sorting (FACS) buffer (1% bovine serum albumin [BSA] in PBS). After blocking, the surface antigens of cells were labeled at 4┬░C for 20 minutes. Supplementary Table S1 lists the antibodies used in the study. To isolate single cells, the cell suspension was filtered through the FACS tube with cell strainer (35 ┬Ąm) snap cap. The samples were acquired and analyzed using FACSVerse cytometer and FACSuite software (BD Biosciences, San Jose, CA, USA).
7. Western blot
After cell culture, the cells were washed with cold PBS and treated with a lysis buffer (150 mM NaCl, 25 mM Tris-Cl, 1% NP-40, and 10 mM EDTA; pH 7.4) to lyse the cells. The protein concentration was quantified using bicinchoninic acid (BCA) protein assay reagent (Pierce, Rockford, IL, USA). Next, 20 ┬Ąg of protein per sample were subjected to sodium dodecyl sulfate polyacrylamide gel electrophoresis (SDS-PAGE). After electrophoresis, the proteins in the gel were transferred to a polyvinylidene fluoride (PVDF) membrane (Bio-Rad, Richmond, CA, USA) for immunoblotting analysis. After the proteins were transferred, PVDF membranes were incubated for 1 hour in 5% BSA in 1X Tris buffered saline with Tween (TBST; 150 mM NaCl, 50 mM Tris-Cl, and 0.1 % Tween 20; pH 7.5), washed with 1X TBST, and incubated overnight at 4┬░C in the primary antibody diluted in 5% BSA in TBST. The PVDF membranes were washed and incubated with 5% BSA in TBST containing horseradish peroxidase-conjugated secondary antibody at room temperature for 1 hour. The membranes were washed three times with TBST, treated with the Western blotting substrate (Pierce ECL, ThermoFisher Scientific, Waltham, MA, USA), and exposed to X-ray (Agpa, Mortsel, Belgium).
8. Water soluble tetrazolium salt assay
A cell viability assay kit (EZ-Cytox, DoGen, Seoul, Korea) was used to measure cell viability. CAFs were seeded in 96-well plates (1├Ś104 cells per well) and incubated at 37┬░C and 5% CO2 for 24 hours. Next, the cells were incubated with different concentrations of the drug for 72 hours, followed by treatment with EZ-Cytox for an additional hour and detection.
9. Immunofluorescence
Cells were fixed in 3.7% paraformaldehyde, permeabilized in 0.1% Triton X-100 in PBS for 10 minutes, and washed with PBS. Next, the cells were blocked with 1% BSA in PBS for 20 minutes, washed with PBS, and stained with primary antibodies overnight. The cells were washed and incubated with fluorescent dye-binding secondary antibodies. The nuclei were counterstained with 4ŌĆÖ,6-diamidino-2-phenylindole (DAPI), and the images of cells were visualized using a laser scanning confocal microscope (Zeiss LSM780, Carl Zeiss Meditec, Jena, Germany).
10. Real-time polymerase chain reaction
Total RNA was extracted from fibroblasts using RNeasy Mini Kit (Qiagen, Hilden, Germany) in accordance with the manufacturerŌĆÖs guidelines, and quantified using spectrophotometry (Nanodrop 2000, ThermoFisher Scientific). Next, SuperScript III First-Strand Synthesis System (ThermoFisher Scientific) was used to reverse transcribe the total RNA, and ABI 7900 HT Fast Real-Time PCR system (Applied Biosystems, Foster City, CA, USA) was used to perform real-time PCR.
PCR was performed using SYBR Green PCR Master Mix (Applied Biosystems) under the following thermal cycling conditions: 95┬░C for 10 minutes, followed by 40 cycles at 95┬░C for 15 seconds, 52┬░C for 15 seconds, and 72┬░C for 30 seconds. To confirm the PCR quality, measurements were performed in triplicate and post-PCR melt curve was analyzed. The Ct value (i.e., the number of cycles in which the detected fluorescence exceeds the threshold) was determined. The comparative Ct method was used to normalize the mRNA level of the gene of interest to the reference gene glyceraldehyde-3-phosphate dehydrogenase (GAPDH); the mRNA level was expressed as fold difference. Supplementary Table S2 lists the primer sequences used in this study.
11. PGE2 enzyme-linked immunosorbent assay
The PGE2 concentration was determined from a standard curve using a commercial enzyme-linked immunosorbent assay (ELISA) kit (Cayman Chemical Company, Ann Arbor, MI, USA) following the manufacturerŌĆÖs protocol. For PGE2 concentration measurement, samples were diluted 100-fold with assay buffer and expressed as ng/mL of protein.
12. Statistical analysis
Statistical analyses were performed using GraphPad Prism software (GraphPad Software Inc., San Diego, CA, USA). TukeyŌĆÖs multiple comparison test and one-way analysis of variance (ANOVA) were used for multiple comparisons. Two-tailed unpaired t-tests were used for simple comparisons. A p<0.05 was considered statistically significant, and significant differences are marked with footnotes (p<0.05, p<0.01, p<0.001, and not significant).
Results
1. Characterization of CAFs and NFs in NSCLC
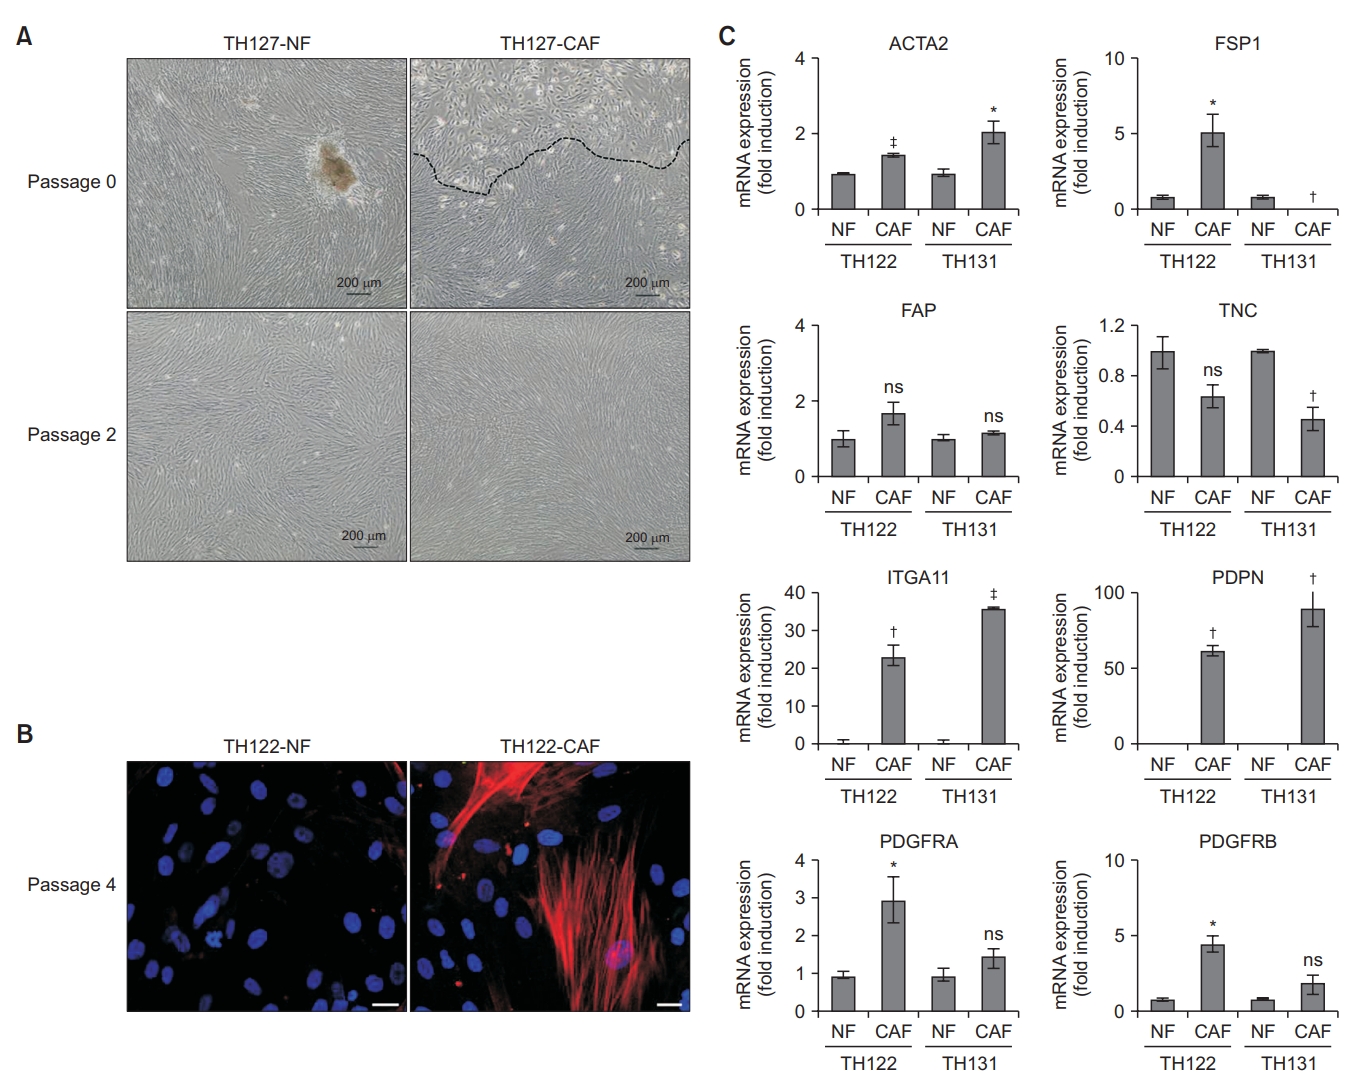
We isolated CAFs and NFs derived from tumor and non-tumor tissues of NSCLC patients, respectively. Table 1 lists the clinical characteristics of CAFs and NFs. CAFs and NFs were isolated from the lung tissues (n=8) and lymph nodes (n=3).
During the early stage of the primary culture period, epithelial cells and fibroblasts grow together from the dissociated cells attached to the culture plate. However, after 1 to 2 passages, epithelial cells no longer grow, but only the fibroblasts grow in the culture plate (Figure 1A). Immunocytochemical analysis revealed that the presence of ╬▒-smooth muscle actin (╬▒-SMA), a candidate marker of CAFs, was confined to the cytoplasm of CAFs (Figure 1B). The mRNA expression of fibroblast-associated genes, including actin alpha 2, smooth muscle (ACTA2; ╬▒-SMA), ferroptosis suppressor protein 1 (FSP1; S100A4), fibroblast activation protein (FAP), tenascinŌĆÉC (TNC), integrin subunit alpha 11 (ITGA11), podoplanin (PDPN), platelet derived growth factor receptor alpha (PDGFRA), and platelet derived growth factor receptor beta (PDGFRB), was analyzed in CAF and NF pairs from two patients (TH122 and TH131) using real-time PCR. CAFs exhibited high mRNA expressions of ACTA2, PDGFRB, PDPN, and ITGA11, and low mRNA expression of TNC (Figure 1C).
2. Gene expression of immunological markers in human lung CAFs
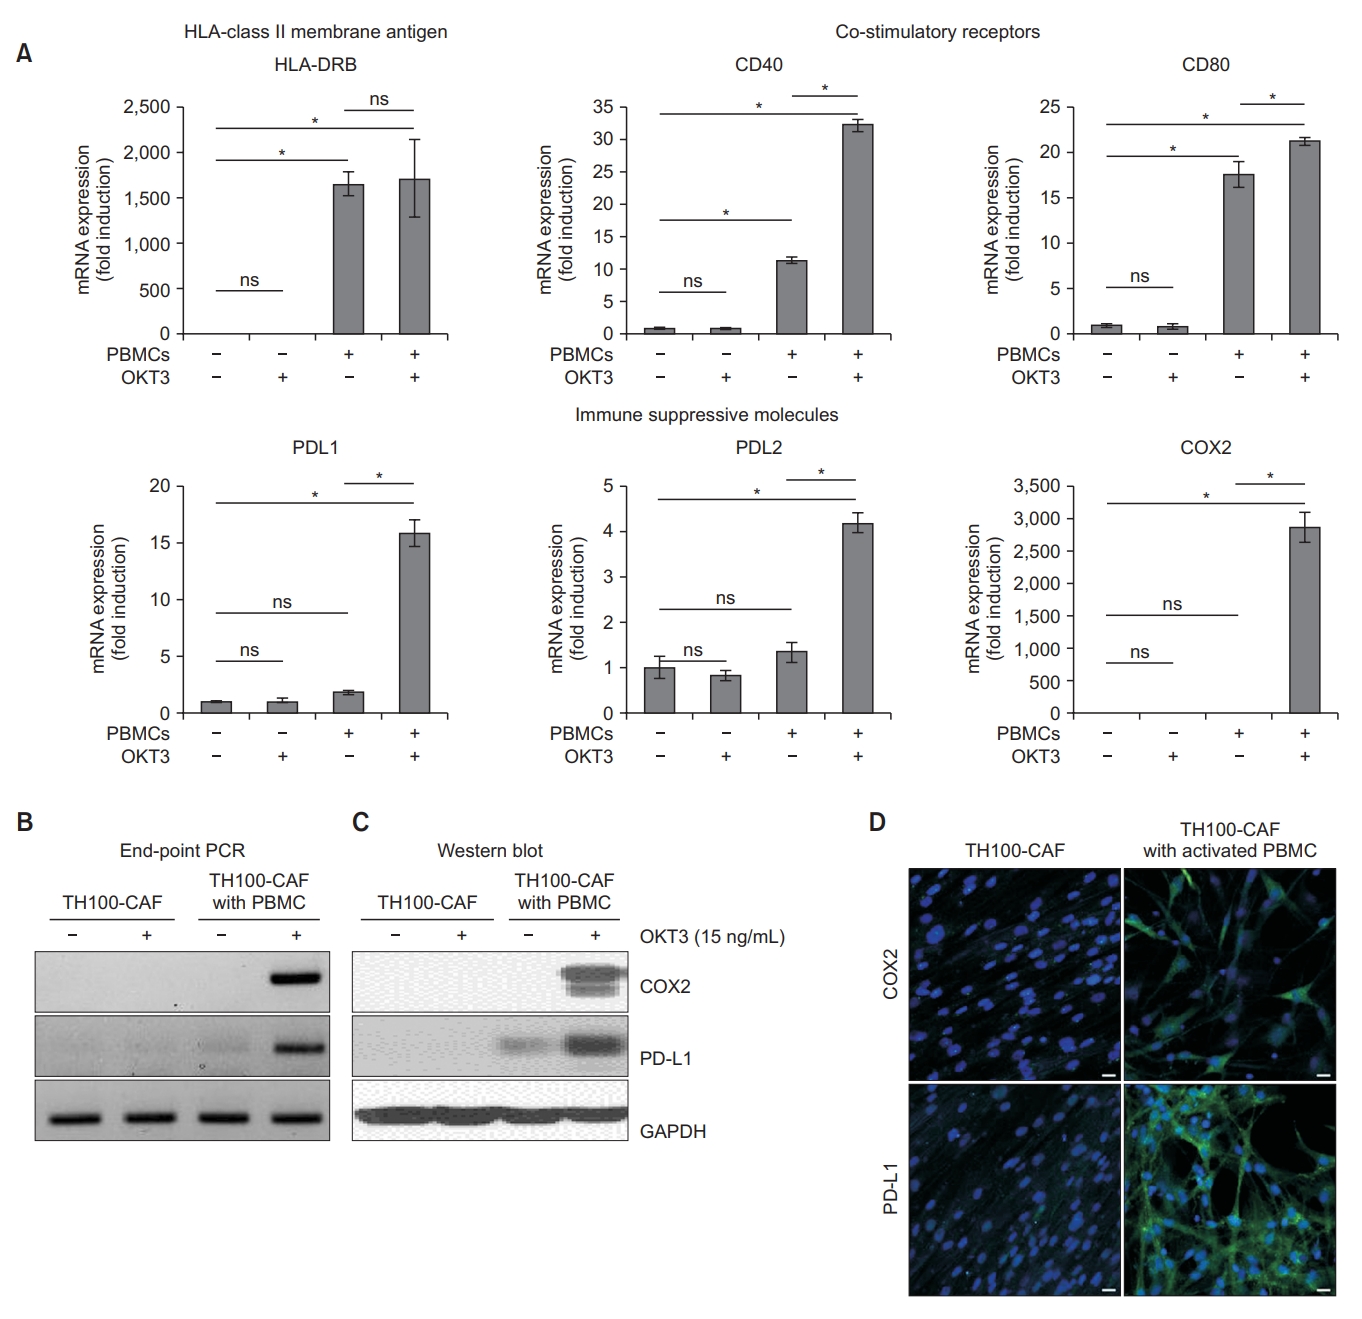
We studied the mRNA expression of membrane human leukocyte antigen (HLA) class II molecules to investigate whether CAFs are immune competent. HLA class I molecules are expressed on most somatic cells, whereas HLA class II molecules are usually expressed only on a subtype of immune cells, including activated T cells, B cells and antigen-presenting cells [21]. To investigate the mRNA expression of immunological markers in CAFs after co-culture with activated T cells, CAFs were co-cultured with PBMCs from healthy donors with or without OKT3 for 5 days. PBMCs without OKT3 stimulation exhibited significantly increased mRNA expressions of CD40, CD80, and HLA-DR in CAFs. Furthermore, co-culture of CAFs and activated PBMCs with OKT3 stimulation was associated with significantly increased mRNA expressions of PD-L1, PD-L2, and COX2 (Figure 2A). Therefore, the mRNA expression of immunological markers was increased in CAFs after co-culture with PBMCs.
3. PD-L1 and COX2 are highly expressed in CAFs after co-culture with activated T cells
We investigated the expression of immunosuppressive molecules, such as COX2 and PD-L1, which are expressed in stromal fibroblasts [22-24]. To explore the role of COX2 and PD-L1 in CAFs, we evaluated their gene expression in CAFs with or without activated PBMCs. The mRNA end-point PCR revealed that the gene expressions of COX2 and PD-L1 were significantly higher in PBMC-activated CAFs than CAFs alone (Figure 2B). The Western blot analysis revealed that the protein expressions of COX2 and PD-L1 were significantly higher in PBMC-activated CAFs than CAFs alone (Figure 2C). The intracytoplasmic and intranuclear localizations of COX2 and PD-L1 ware confirmed by immunocytochemistry (Figure 2D).
4. CAFs suppress CD4+ and CD8+ T cell proliferation and inhibit the increase in CD8+ T cell subsets among proliferating CD3+ T cells
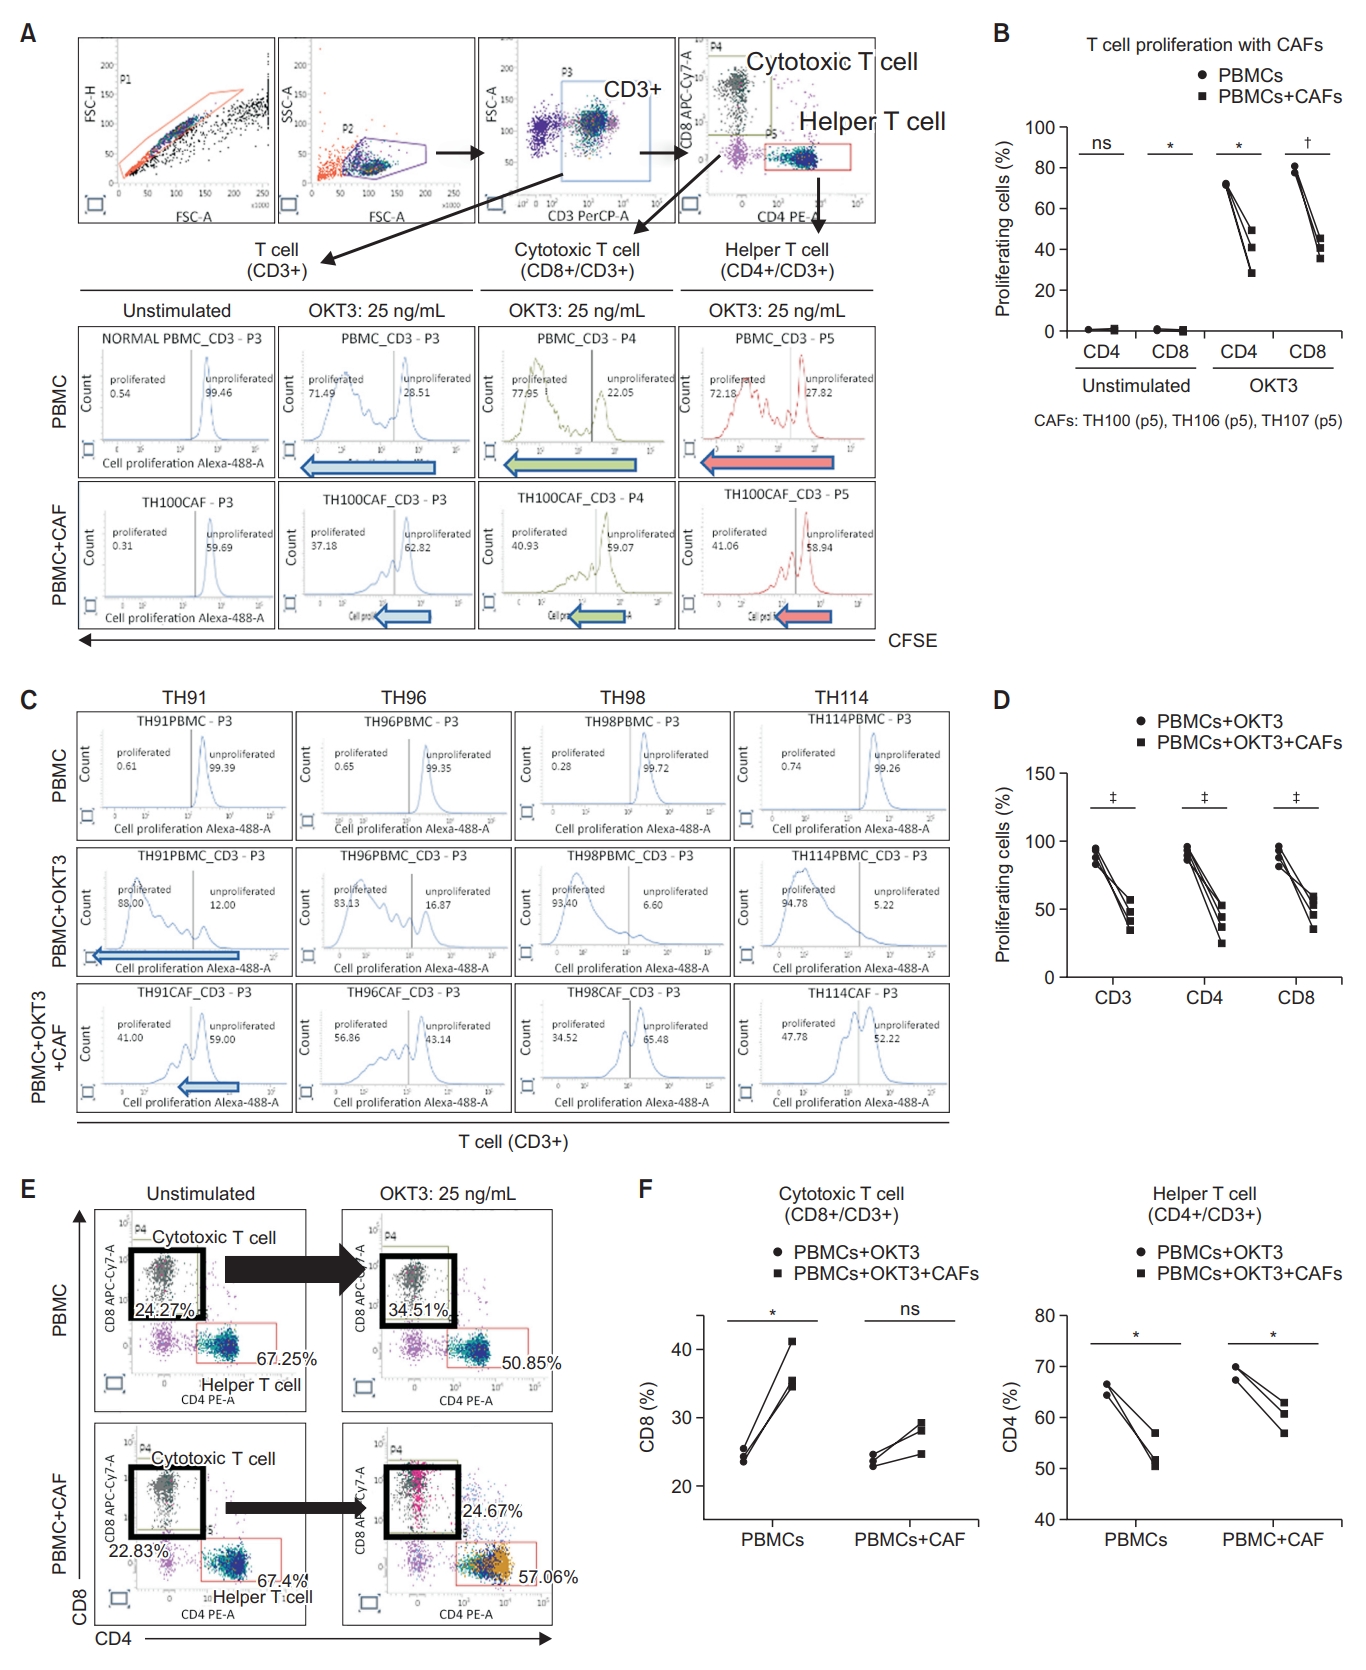
To investigate how CAFs affect the proliferative response of T cells, CFSE-labeled PBMCs from healthy donors were cultured with or without patient-derived CAFs that were or were not stimulated by OKT3 for 5 days (Figure 3A). When only T cells were cultured, proliferation was increased by OKT3 stimulation. However, co-culture with allogenic CAFs significantly decreased the proliferation of CD4+ and CD8+ T cells (Figure 3A, B). We performed several experiments using autologous PBMCs to investigate whether major histocompatibility complex (MHC) mismatch between CAFs and PBMCs affected the assay results. Similar effects were observed when PBMCs and CAFs from the same patient (autologous pairs) were co-cultured (Figure 3C, D). Furthermore, after OKT3 stimulation, the population of CD8+ T cells increased by 10.24% (from 24.27% to 34.51%) in the absence of CAFs and increased only by 1.84% (from 22.83% to 24.67%) in the presence of CAFs (Figure 3E). Similar results were observed for autologous pairs of PBMCs and CAFs (Figure 3F). These results suggest that CAFs inhibit CD4+ and CD8+ T cell proliferation and suppress the increase in CD8+ T cells among the stimulated CD3+ T cells.
5. CAFs promote the expression of programmed death-1 in cytotoxic T and helper T cells
Immune checkpoints that are highly expressed in the TME suppress antitumor immunity, and are associated with cancer progression and a poor prognosis. We investigated whether CAFs are involved in the protein expression of immunosuppressive molecules, such as PD1, cytotoxic T-lymphocyte associated protein 4 (CTLA4), lymphocyte-activation gene 3 (LAG3), and T cell immunoglobulin and mucin domain 3 (TIM3). Co-culture of allogenic CAFs significantly induced the protein expression of PD1 in CD4+ and CD8+ T cells (Figure 4A, B), but did not increase the protein expressions of CTLA4, LAG3, and TIM3 (Figure 4C, D).
6. Inhibition of T cell cytotoxicity by CAF-CM
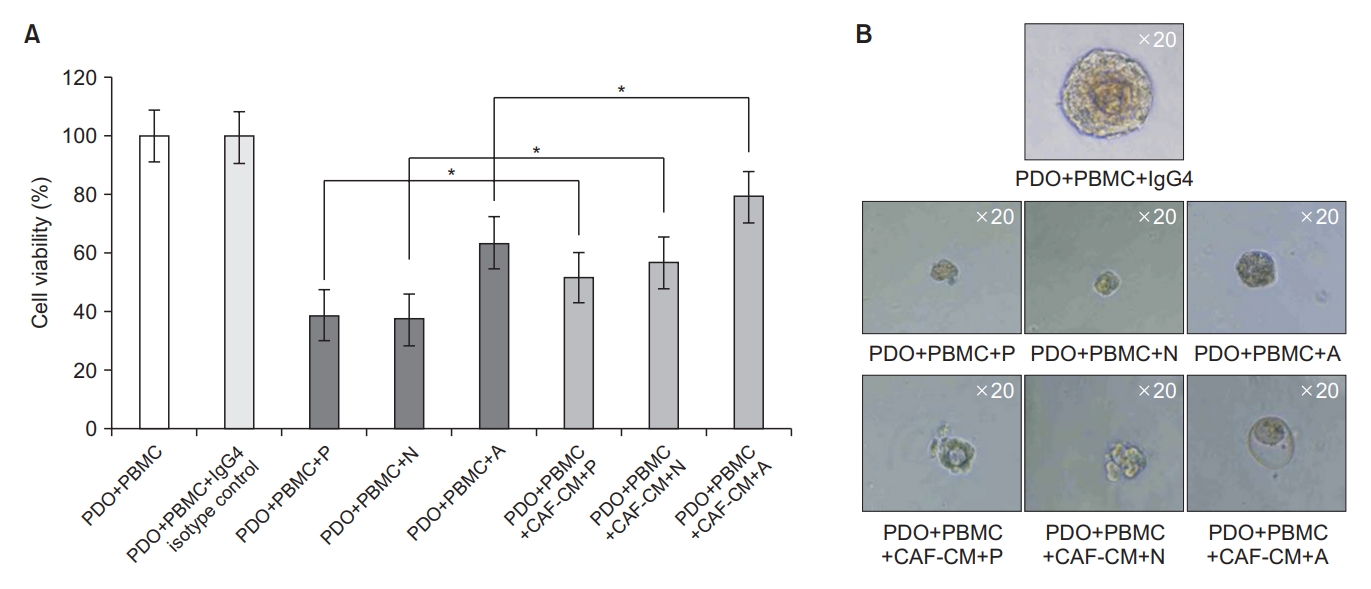
Next, to further elucidate the mechanism of immune evasion by CAF, we investigated the effect of CAF-CM on the cytotoxicity of T cells. We performed tumor organoid killing assay using the autologous pair of PDOs and PBMCs (TH189). CAF-CM was also harvested using CAFs derived from the same patient (TH189). The mixture of PDO and PBMC (1:2) were cultured for 7 days with ICPIs (pembrolizumab, nivolumab, and atezolizumab) in the presence or absence of CAF-CM. After 7 days of co-culture, the killing of tumor organoids by autologous T cells were significantly reduced by the treatment of CAF-CM in pembrolizumab, nivolumab, and atezolizumab groups, respectively (all p<0.05) (Figure 5A). Representative light microscopy images also showed that the sizes of tumor organoids were smaller in the groups without CAF-CM than in those with CAF-CM (Figure 5B).
7. COX2 inhibitors restored T cell proliferation and CD8+ T cell subset
To investigate the roles of COX2 and PD-L1 in the immunosuppressive function of CAFs, we evaluated the effects of COX2 inhibitors, such as celecoxib and indomethacin. The toxic effects of these drugs on CAFs were measured using the water soluble tetrazolium salt method. Treatment of CAFs with serial drug concentrations revealed no significant toxicity of celecoxib and indomethacin treatment on CAFs (IC50; indomethacin, 662 ┬ĄM; celecoxib, 60.09 ┬ĄM) (Figure 6A). Indomethacin partially restored the proliferation of CD4+ and CD8+ T cells, which was inhibited by co-culture with CAFs (Figure 6B). Treatment with different doses of celecoxib increased the proliferation of CD3+ T cells which were reduced by CAFs (Figure 6C). We also investigated whether direct cell-to-cell contact plays an important role in these effects. T cell proliferation was reduced to a lesser extent by CAFs in the indirect co-culture condition (95.70% at PBMC+OKT3 vs. 78.58% at PBMC+OKT3+CAF; net reduction of 17.12%) than in the direct co-culture condition (96.06% at PBMC+OKT3 vs. 41.70% at PBMC+OKT3+CAF; net reduction of 54.36%) (Figure 6C). Therefore, the direct cellto-cell contact is important for the full inhibitory effect of CAFs on CD3+ T cells. CD3+ T cell proliferation was partially restored by celecoxib (Figure 6C). Celecoxib also partially restored the proportion of CD8+ T cells, which was reduced by co-culture with CAFs (Figure 6D). These results revealed that CAFs inhibited the increase in OKT3-stimulated CD8+ T cell subset, but celecoxib treatment at 10 and 25 ┬ĄM increased the proportion of CD8+ T cells, which was decreased by co-culture with CAFs.
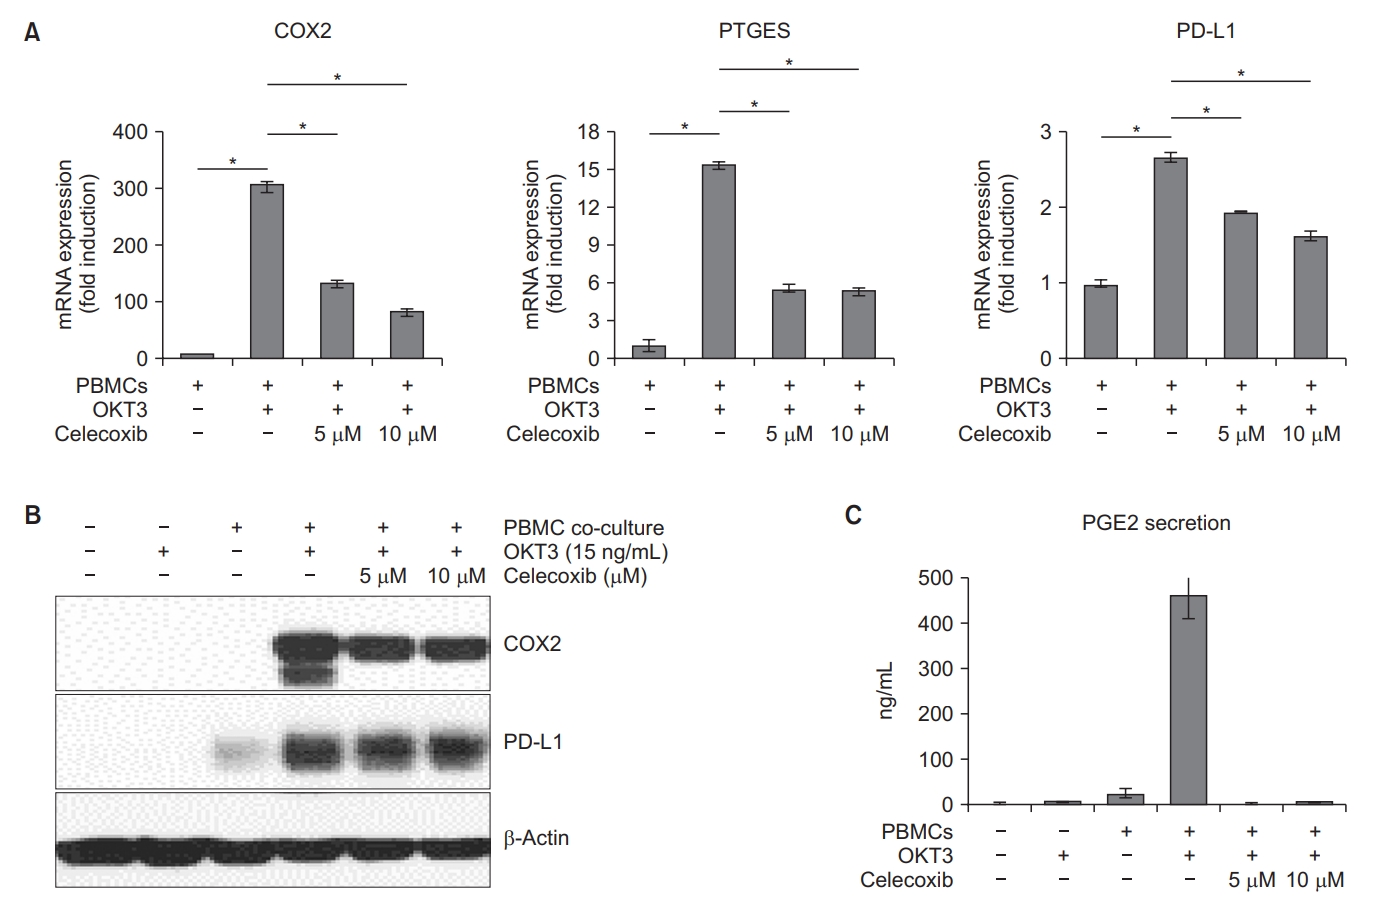
8. Effects of COX2 inhibition on PD-L1 expression in CAFs after co-culture with activated T cells
We evaluated the PD-L1 expression in CAFs after COX2 inhibition to investigate whether PD-L1 expression is regulated by COX2 activity. CAFs and activated PBMCs were treated with the selective COX2 inhibitor celecoxib (5 and 10 ┬ĄM) and the PD-L1 expression was analyzed. The end-point RT-PCR and Western blot analysis demonstrated that celecoxib treatment significantly downregulated the total RNA and protein levels of PD-L1 compared to the untreated conditions (Figure 7A, B). Additionally, the expression of mPGES1 (prostaglandin E synthase [PTGES]) and secretion of PGE2, which are important downstream effectors of the COX2 pathway, were reduced by celecoxib treatment (Figure 7A, C).
Discussion
Our results demonstrated that the expression of immune suppressive markers, such as PD-L1 and COX2, was increased in NSCLC-derived CAFs after direct co-culture with activated T cells. CAFs promote the expression of programmed death-1 (PD-1) in CD4+ and CD8+ T cells, and strongly inhibit T cell proliferation. CAF-CM decreased the cytotoxicity of T cells. COX2 inhibitors restored the proliferative capacity of CD4+ and CD8+ T cells and suppressed the levels of COX2, PTGES, PGE2, and PD-L1 in CAFs.
The TME has been demonstrated as one of the regulating factors of tumor invasion and progression. CAFs are activated fibroblasts that are located within the TME, have potent tumor-modulating effects, and promote cancer recurrence and chemotherapy resistance [25,26]. Previous studies of NSCLC patients have found that the gene expression and methylation profiles of CAFs predicted tumor recurrence and patient survival [27,28]. Moreover, in patients with lung adenocarcinoma, PDPN-positive CAFs were significantly associated with lymph node metastasis and recurrence [29].
Among various cells present in the TME, CAFs play a critical role in the complex process of tumor-stroma interaction. Previous studies have reported that CAFs inhibit the T cell function by promoting the binding of the ligands PD-L1 and PD-L2 expressed on CAFs and their receptor PD-1 expressed on T cells [24,30,31]. Khalili et al. [30] reported that melanoma-derived fibroblast exhibited upregulation of PD-L1 and PD-L2, which were bound to PD-1 and interrupted the CD8+ T cell function. Gorchs et al. [31] also reported that pancreatic cancer-derived CAFs expressed high levels of PD-L1 and PD-L2, and promoted the expression of immunosuppressive molecules, such as LAG3, TIM3, CTLA4, and PD-1, in proliferating T cells, thereby contributing to T cell dysfunction. In our study, OKT3 was used for T cell activation and we demonstrated that NSCLC-derived CAFs reduced the proliferation of OKT3-stimulated T cells. However, our investigation of NSCLC patients revealed that among the co-inhibitory immune checkpoint receptors expressed on T cells, only PD1 was upregulated by the co-culture with CAFs. However, TIM3, CTLA4, and LAG3 were not upregulated by co-culture with CAFs.
CAFs could secrete various cytokines, chemokines, and growth factors, which could contribute to chemotherapy resistance or cancer progression and metastasis [6]. In this study, we showed that CAF-CM could reduce the cytotoxicity of T cells in the co-culture model of autologous pair of PDOs and PBMCs (Figure 5). Although it seems that humoral factors such as cytokines or chemokines derived from CAFs influence on the cytotoxicity of T cells, further studies are needed to elucidate the exact mechanism of the alteration of T cell cytotoxicity.
Recent studies have reported that CAFs function as antigen-presenting cells. CAFs express MHC class II molecules on the cell membrane and maintain the ability to present ovalbumin peptides to CD4+ T cells in vitro. MHC class II molecules present on CAFs act as a decoy receptor, and CAFs inactivate CD4+ T cells through differentiation into immunosuppressive Tregs or anergy induction [32]. In the present study, we found that the expressions of HLA-DR and two major co-stimulatory receptors (CD40 and CD80) were significantly upregulated in NSCLC-derived CAFs after co-culture with PBMCs. Further studies are needed to identify the mechanisms for the expression of immunological markers in NSCLC-derived CAFs and their interactions with T cells.
Several studies have reported that COX2 is constitutively overexpressed in various cancer types, such as esophageal, head and neck, pancreatic, colon, breast, and lung; COX2 overexpression in tumors is also generally related to poor outcomes [16,33,34]. Edelman et al. [35] reported that COX2 expression was a negative prognostic factor in patients with advanced NSCLC.
Interestingly, patients with moderate to high levels of COX2 expression who received celecoxib treatment exhibited better overall survival than COX2-expressing patients who did not receive celecxib [35]. Our co-culture experiments revealed that CAFs induced PD-1 expression in activated T cells through a direct cell-to-cell contact mechanism and a COX2-dependent manner. We also found that COX2 inhibitors significantly reduced the PD-L1 expression in CAFs. In the present study, COX2 signaling played an important role in the immunosuppressive function of NSCLC-derived CAFs by regulating PD-L1 expression. More research is needed to evaluate the combination of COX2 inhibitors and immune checkpoint inhibitors in NSCLC patients.
In conclusion, CAFs promote immune evasion by suppressing the function of CD4+ and CD8+ T cells via their effects on COX2 and PD-L1. Furthermore, the immunosuppressive function of CAFs was alleviated by COX2 inhibitors.


 PDF Links
 PubReader
 ePub Link
 Data Sharing Statement
 Full text via DOI
 Supplement1
 Print
Print Download Citation