The Influence of Asian Dust, Haze, Mist, and Fog on Hospital Visits for Airway Diseases
Article information
Abstract
Background
Asian dust is known to have harmful effects on the respiratory system. Respiratory conditions are also influenced by environmental conditions regardless of the presence of pollutants. The same pollutant can have different effects on the airway when the air is dry compared with when it is humid. We investigated hospital visits for chronic obstructive pulmonary disease (COPD) and asthma in relation to the environmental conditions.
Methods
We conducted a retrospective study using the Korean National Health Insurance Service claims database of patients who visited hospitals in Chuncheon between January 2006 and April 2012. Asian dust, haze, mist, and fog days were determined using reports from the Korea Meteorological Administration. Hospital visits for asthma or COPD on the index days were compared with the comparison days. We used two-way case-crossover techniques with one to two matching.
Results
The mean hospital visits for asthma and COPD were 59.37 ± 34.01 and 10.04 ± 6.18 per day, respectively. Hospital visits for asthma significantly increased at lag0 and lag1 for Asian dust (relative risk [RR], 1.10; 95% confidence interval [CI], 1.01-1.19; p<0.05) and haze (RR, 1.13; 95% CI, 1.06-1.22; p<0.05), but were significantly lower on misty (RR, 0.89; 95% CI, 0.80-0.99; p<0.05) and foggy (RR, 0.89; 95% CI, 0.84-0.93; p<0.05) days than on control days. The hospital visits for COPD also significantly increased on days with Asian dust (RR, 1.29; 95% CI, 1.05-1.59; p<0.05), and were significantly lower at lag4 for foggy days, compared with days without fog (RR, 0.85; 95% CI, 0.75-0.97; p<0.05).
Conclusion
Asian dust showed an association with airway diseases and had effects for several days after the exposure. In contrast to Asian dust, mist and fog, which occur in humid air conditions, showed the opposite effects on airway diseases, after adjusting to the pollutants. It would require more research to investigate the effects of various air conditions on airway diseases.
Introduction
Airborne particles emitted from geologic media are commonly referred to as dust, and these can range in size from 1 to 10,000 µM, with a large percentage falling within the particulate matter (PM)10 particle-size category1. Dust can be carried by wind into sensitive environments and is known to have harmful effects on the respiratory system. In recent years, Asian dust has become a critical issue of concern in Asia2. South Korea has four distinct seasons, and Asian dust occurs mainly in the spring (March to May), although it has also been observed in the winter (November to January) by the Korea Meteorological Administration. Asian dust has different effects on airway diseases under different environmental conditions. Most studies on dust have reported an association between Asian dust and asthma or chronic obstructive pulmonary disease (COPD)3456, but there has been little research on its effects on pulmonary diseases under various atmospheric conditions.
Numerous studies indicate that environmental exposure to PM, dust, gases, fumes, or organic antigens may also be risk factors for airway diseases such as asthma or COPD789. Patients with airway diseases can have increased symptoms and hospital admissions with increasing environmental pollution10; specifically, nitrogen oxides and particulates can interact with other factors such as viral infection in asthma to exacerbate symptoms rather than acting alone, and a similar mechanism might occur with COPD1112.
The respiratory system is also influenced by environmental conditions independent of pollutant presence. Generally, atmospheric phenomena occurs under two different air conditions: dry air and humid air. Asian dust, fog, mist, and haze are environmental conditions that decrease the clarity of the sky. Haze occurs in dry air, while mist and fog occurs in relatively humid air; fog is distinguished from mist by visibility <1 km13, and mist occurs at lower humidity than fog. Physiologically, inhalation of particulate matter, an aerosol of water, or simply cold or dry air may cause bronchial constriction14, but the associations among mist, fog, haze, and airway diseases have received little attention.
We hypothesized that hazy, foggy, or misty air would influence the airway differently. We investigated hospital visits for COPD and asthma under these air conditions in Chuncheon, Korea from January 1, 2006, to April 30, 2012.
Materials and Methods
We conducted a retrospective study based on the Korean National Health Insurance Service (KNHIS) claims database of patients who visited hospitals in Chuncheon, Gangwon-do, between January 1, 2006, and April 30, 2012. The KNHIS Program, which provides compulsory universal health insurance, was implemented in 1989 and has managed a computerized database for all medical facilities in South Korea since 1998. The KNHIS provides medical insurance for all Koreans, and all South Koreans are legally obliged to become members of this national insurance system. Computerized records of daily clinic visits or hospital admissions are available for each contracted medical institution. All medical institutions must submit standard claim documents for medical expenses on a computerized form, which includes the date of admission and discharge, identification number, gender, birthday, and the diagnostic codes for each admission based on the Korean version of the International Classification of Diseases, 10th revision. Asthma or COPD-related diagnoses include predominantly allergic asthma (J45.0), unspecific asthma (J45.9), status asthmaticus (J46.0), other specified COPD (J44.8), and unspecified COPD (J44.9). Information on asthma- and COPD-related healthcare use from the KNHIS claims database contained the frequency of healthcare visits, admissions, the number of pulmonary function tests performed, and any prescribed medications. This study protocol was approved by the Institutional Review Board of Kangwon National University Hospital.
1. Meteorological data
Chuncheon (37°89'N, 127°73'E) is a relatively small city (population, 0.25 million; area, 1,116 km2) with a mostly rural character outside the central district; it does not contain industrial complexes.
The National Meteorological Administration of the Republic of Korea supplied data on air quality in Chuncheon. The air monitoring station provided hourly ambient air concentrations of PM10, sulfur dioxide (SO2), nitrogen dioxide (NO2), ozone (O3), and carbon monoxide (CO). Information on the 24-hour average temperature (℃), dew point, wind speed, cloud cover, sunlight duration, and relative humidity (%) was provided by the National Meteorological Office. Asian dust, haze, mist, and fog episodes reported by the National Meteorological Office were classified as index days.
2. Statistical analysis
In our primary analysis, hospital visits for asthma or COPD on the index days were compared with those on comparison days. We used the two-way case-crossover technique with one-to-two matching. Index days were days containing Asian dust, haze, mist, or fog occurrences, and comparison days were the same days of the week as the corresponding index days. We selected two comparison days for each index day, 7 days before and 7 days after the index day. If dust occurred on the comparison day initially selected, days 14 preceding/following the index day were selected. Candidate comparison days were excluded if the same phenomenon occurred within 7 days before or after the selected day or within 14 days since hospital visits, given that they are influenced by season and the day of the week.
Environmental effects, if any, may be delayed over a period of several days. To test this hypothesis, we examined the lagged effects on the days of occurrences and up to 5 days (from lag0 to lag5) after the events. We used the t test to compare hospital admissions; counts of hospital admissions were modeled using Poisson regression. The rate ratio for atmospheric phenomenon versus non-atmospheric phenomenon was estimated in a Poisson regression model, adjusting for temperature, humidity, PM10, and O3. All analyses were performed using the SAS version 9.2 (SAS Institute Inc., Cary, NC, USA); p-values of <0.05 (two-sided) were considered statistically significant.
Results
Mean hospital visits for asthma were 59.37±34.01 per day; hospital admissions occurred 0.72±0.96 times per day, and outpatient clinic visits occurred 58.68±33.74 times per day. Mean hospital visits for COPD were 10.04±6.18 times per day; hospital admissions occurred 0.30±0.64 times per day, and outpatient clinic visits occurred 9.75±6.14 times per day.
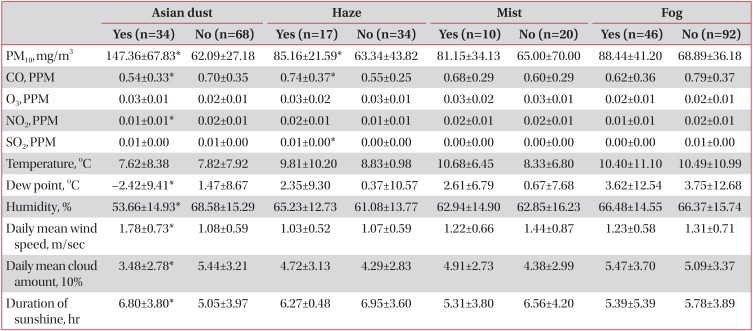
In total, 61 dust storms, 248 hazes, 257 mists, and 89 fog episodes (index days) were identified between January 1, 2006, and April 30, 2012 in Chuncheon city; 52 dust storms, 167 haze, 176 mist, and 51 fog episodes were identified as comparison days. However, some events were counted that occurred together with other environmental conditions. In terms of each episode alone, 34 Asian dust storms, 17 hazes, 10 mists, and 46 foggy days were identified after excluding overlaps with other atmospheric conditions. The levels of air pollutants were higher under dry air conditions (Table 1), and PM10 was significantly higher on dusty and hazy days compared with control days. CO was significant lower on dusty and higher on hazy days. There was no difference in air pollutant episodes between the misty or foggy days and the control days.

Mean levels of environmental variables on event days (Asian dust, haze, mist, and fog) and comparison days
1. Meteorological conditions and asthma-related hospital visits
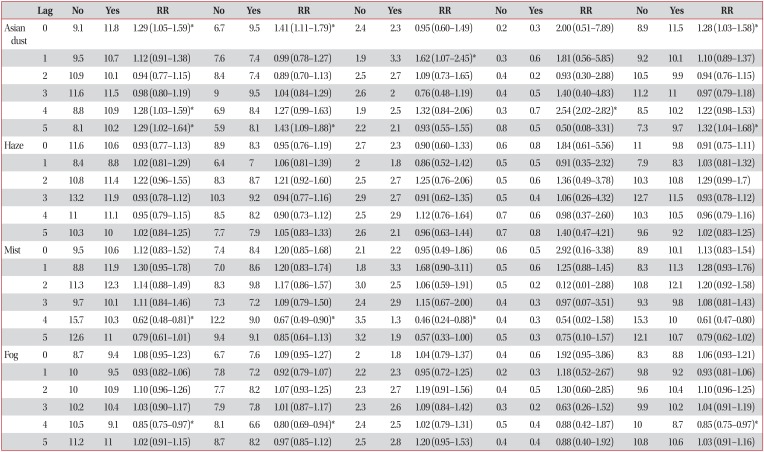
Hospital visits for asthma were significantly associated with the occurrence of Asian dust (relative risk [RR], 1.10; 95% confidence interval [CI], 1.01-1.19; p<0.05) and haze (RR, 1.13; 95% CI, 1.06-1.22; p<0.05) compared with control days (Table 2). In the case of humid conditions, hospital visits were significantly lower on misty (RR, 0.89; 95% CI, 0.80-0.99; p<0.05) and foggy (RR, 0.89; 95% CI, 0.84-0.93; p<0.05) days than on days without these conditions.

Relative risk of hospital visits for asthma
Hospital visits on days containing Asian dust showed an increasing trend from lag1 to lag5. Similarly, asthma-related hospital visits reflected increasing numbers of patients in all sexes. The overall number of hospital visits was higher for male than female patients, with peak hospital admissions at lag1 (RR, 2.40; 95% CI, 1.23-4.68; p<0.05) and peak visits to outpatient clinics at lag4 (RR, 1.21; 95% CI, 1.12-1.30; p<0.05). Hospital visits on hazy days showed a similar trend between lag0 to lag5. The number of hospital admissions was not affected by haze at any lag.
Conversely, hospital visits showed a decreasing trend from lag0 (RR, 1.02; 95% CI, 0.92-1.23) to lag5 (RR, 0.72; 95% CI, 0.65-0.80; p<0.05) for misty days, and there was a significantly lower number of hospital visits at lag5 for foggy days (RR, 0.85; 95% CI, 0.75-0.97; p<0.05). The occurrence of fog or mist had no influence on the number of admissions.
2. Meteorological conditions and COPD-related hospital visits
Hospital visits for COPD were significantly associated with the occurrence of Asian dust storms (RR, 1.29; 95% CI, 1.05-1.59; p<0.05) (Table 3). The occurrence of haze, mist, and fog did not affect COPD-related hospital visits.

Relative risk of hospital visits for COPD
Frequent hospital visits occurred with Asian dust from lag0 (RR, 1.29; 95% CI, 1.05-1.59; p<0.05) to lag5 (RR, 1.29; 95% CI, 1.02-1.64; p<0.05). COPD-related admissions related to days containing Asian dust storms peaked at lag4 (RR, 2.54; 95% CI, 2.02-2.82; p<0.05) (Figure 1). The number of hospital visits was greater for male than female patients.

Relative risk for airway disease. COPD: chronic obstructive pulmonary disease.
COPD-related hospital visits were significantly lower at lag4 for days with fog (RR, 0.85; 95% CI, 0.75-0.97; p<0.05) than for days without fog. Hospital visits were not affected by mist.
Discussion
We investigated the effects of various atmospheric conditions on certain airway diseases after adjusting for known air pollutants. Our results first showed that frequent hospital visits of airway diseases such as COPD and asthma were associated with environmental conditions such as haze, fog, and mist, as well as with Asian dust in Korea. Patients with airway diseases were negatively affected by Asian dust and haze, but harmful effects were mitigated by misty or foggy conditions.
Several studies have investigated the association between Asian dust exposure and asthma exacerbation3,15161718, but their results have not yielded any consensus. Studies from Korea and Japan showed a significant decrease in peak flow for patients with asthma, whereas other studies showed subtle linkage or no obvious associations with hospital visits. Several epidemiologic studies confirmed elevated morbidity and mortality rates among individuals with COPD following exposure to PM101920212223; according to a Taiwanese study5, Asian dust storms elevated concentrations of PM10 and led to exacerbations of COPD symptoms. Our study also showed that Asian dust influenced airway diseases, with COPD and asthma-related hospital visits increasing up to lag5, especially in outpatient clinics. Air pollutants can induce oxidative and inflammatory responses in the airways, causing carbon dioxide (CO2) retention and hypoxia-related CO toxicity, and they may contribute to the lagged hospital visits observed in response to exacerbated COPD symptoms2425. Arbex et al.24 reported that hospital visits typically occurred 6 days following exposure. Asian dust contains several noxious components and occurs under dry air conditions that can independently induce bronchial constriction14; these characteristics may have further negative effects on airway conditions.
This study is first reports in Korea that the effects of haze, mist, and fog, which are defined by visibility, after adjusting for air pollutants. While haze had negative effects on asthma, we found that foggy or misty air had protective effect on airway diseases. COPD- or asthma-related hospital visits occurred less frequently on days with mist and fog than on other days. There was a decreasing pattern of hospital visits of patients with asthma from lag0 to lag4. In the case of COPD, hospital visits related to foggy days were infrequent on lag4. Components of mist or haze may be different, but we could not determine how foggy or misty conditions could have potential positive effects on the airway. Mist and fog consist of tiny water drops floating in the air, and their effects on airway diseases would be a combination of several factors. More studies are necessary to determine the effects of these atmospheric conditions on airway diseases.
Women are typically more susceptible to harmful effects of air pollution and cigarette smoke262728; however, hospital visits were observed more frequently for male than for female patients in our study. This phenomenon may be associated with amount of outdoor activity, but we could not determine how much time each person spent outdoors on event days.
Our study has a few limitations. First, this study was based on the medical insurance database and therefore could not assess the exact association between the environmental factors and the diseases. We could not investigate the accuracy of the diagnostic code in the database, and all visits may not have been a result of COPD or asthma. However, definitions of COPD exacerbation based on use of health care have also been proposed, e.g., unscheduled physician visits, changes or increases in medication, use of antibiotics or oral steroids at exacerbation, and hospital admission29. In this study, when Asian dust or mist occurred, patients with COPD or asthma showed more visits of health care. In a way, frequent hospital visits could say to reflect the acute exacerbation of COPD or asthma.
Second, acute exacerbation of COPD or asthma symptoms is often caused by viral or bacterial infection30. We did not analyze all the components of each atmospheric condition, but there was a significant difference in humidity and temperature between the event days and control days. These factors may also lead to the propagation of certain microbes in the air, but we were unable to assess confounding factors such as viral or bacterial infection. However, we investigated and analyzed the atmospheric effect for 6 years, and there is a low probability of yearly endemic infections occurring. Furthermore, we used the case-crossover design to adjust for factors such as seasonal variation and exposed time variation.
Third, the number of inpatients enrolled in this study was small compared with the outpatients, and overall results were mainly dependent on the results for outpatients. Also, we could not differentiate the severity of symptoms, given that hospital admission simply reflects exacerbation of the airway disease. Prospective cohorts or randomized controlled trials are required to investigate the exact association after adjusting for disease severity.
Finally, this study was performed in a single small city, Chuncheon. We cannot generalize our results to every patient with COPD or asthma, and a larger and multi-national study is required to study the relationship between environmental conditions and airway diseases.
In conclusion, Asian dust was associated with hospital visits for airway diseases and may have an effect for several days after the exposure. Haze also had negative effects on asthma patients. In contrast, mist and fog had positive effects on hospital visits for airway diseases after adjusting for air pollutants. Given that most air conditions can affect airway diseases, further studies are required to investigate the effects of various air conditions on airway diseases.
Acknowledgements
This study was supported by a grant from the Ministry of Environment, Republic of Korea.
This study was supported by 2013 Research Grant from Kangwon National University (C1010844-01-01).
Notes
Conflicts of Interest: No potential conflict of interest relevant to this article was reported.