Lung Microbiome Analysis in Steroid-Naїve Asthma Patients by Using Whole Sputum
Article information
Abstract
Background
Although recent metagenomic approaches have characterized the distinguished microbial compositions in airways of asthmatics, these results did not reach a consensus due to the small sample size, non-standardization of specimens and medication status. We conducted a metagenomics approach by using terminal restriction fragment length polymorphism (T-RFLP) analysis of the induced whole sputum representing both the cellular and fluid phases in a relative large number of steroid naïve asthmatics.
Methods
Induced whole sputum samples obtained from 36 healthy subjects and 89 steroid-naїve asthma patients were analyzed through T-RFLP analysis.
Results
In contrast to previous reports about microbiota in the asthmatic airways, the diversity of microbial composition was not significantly different between the controls and asthma patients (p=0.937). In an analysis of similarities, the global R-value showed a statistically significant difference but a very low separation (0.148, p=0.002). The dissimilarity in the bacterial communities between groups was 28.74%, and operational taxonomic units (OTUs) contributing to this difference were as follows: OTU 789 (Lachnospiraceae), 517 (Comamonadaceae, Acetobacteraceae , and Chloroplast), 633 (Prevotella), 645 (Actinobacteria and Propionibacterium acnes), 607 (Lactobacillus buchneri, Lactobacillus otakiensis, Lactobacillus sunkii, and Rhodobacteraceae), and 661 (Acinetobacter, Pseudomonas, and Leptotrichiaceae), and they were significantly more prevalent in the sputum of asthma patients than in the sputum of the controls.
Conclusion
Before starting anti-asthmatic treatment, the microbiota in the whole sputum of patients with asthma showed a marginal difference from the microbiota in the whole sputum of the controls.
Introduction
Asthma is a chronic inflammatory airway disease in which various cells and mediators play a role in developing episodic dyspnea with wheezing as well as coughing1. Previously, asthma was known to be caused by external stimuli such as allergens and genetic susceptibility to allergic diseases; however, according to recent research, microbial communities of the airway may contribute to the pathogenesis of asthma.
As a representative example of bacterial involvement in asthma, Mycoplasma pneumoniae and Chlamydophila pneumonia were isolated from patients with acute asthma exacerbation2. Invasive pneumococcal pneumonia was found to be 2 times more common in the asthma patients as compared to that in the control group2. In addition, a risk of developing asthma and recurrence of wheezing was reported in infants having colonizers in their hypopharynx including the combination of Streptococcus pneumoniae, Haemophilus influenzae, and Moraxella catarrhalis3. However, these results reflect only a small culturable portion of the entire microbiota but not whole microorganisms.
The method for metagenomics study has been used recently to overcome this limitation. In metagenomic approach, the uncultured microorganisms can be now identified by targeting the 16S ribosomal RNA (16S rRNA) gene. Traditionally, gut microbiota were the main topics of human metagenomic research but interest in the role of the microbiome in asthma has been increasing recently 456789. Because of small sample size, diverse specimens and different asthma treatment status, results of metagenomic approaches on microbial compositions in airways of patients with asthma were not consistent amongst studies.
Previous studies on the microbiome in asthma patients were performed using the bronchoalveolar lavage (BAL) fluid. Some researchers attempted microbiome analysis by analyzing induced sputum samples101112. However, those studies using sputum were performed with the fluid phase or the cellular phase only. This is because an appropriate sample for microbiome study in airway diseases has not been established yet.
This study was performed to reassess the characteristics of the microbiome in steroid-naїve asthma patients using induced sputum, easily obtainable airway samples, including not only fluid phase but also cellular phase in a large sample size
Materials and Methods
1. Study population
A total of 135 subjects (36 healthy subjects and 89 asthma patients) who were non-smokers or ex-smokers (less than 10 pack-years) were selected for the study. Subjects with any recent infection in either upper or lower airways prior to enrollment of the study and those who ever used antibiotics within the last 1 month were excluded from the study. Subjects who were never diagnosed with asthma and did not have any respiratory symptoms were enrolled as the healthy control group. Patients who were newly diagnosed with asthma and did not start anti-asthmatic treatment (treatment-naїve) were considered as the asthma patients group. Asthma was defined as chronic respiratory symptoms such as coughing, sputum, dyspnea, and wheezing in addition to the confirmation of airway reversibility or airway hyperresponsiveness (AHR). Airway reversibility was defined as an increase in a forced expiratory volume in 1 second (FEV1) of 12% and 200 mL or greater when it was measured 15 minutes after inhalation of a short acting β2 agonist and AHR was defined as less than 16 mg/mL of provocative concentration of mechacholine causing a 20% fall in FEV1 (PC20)13. Patients with a history of using anti-inflammatory anti-asthmatic drugs including inhaled corticosteroids were excluded from the study.
The basic demographic characteristics of the patients, skin test results, the results of pulmonary function tests, serum total IgE, and peripheral blood cell counts were investigated.
2. Sputum induction and DNA extraction
Sputum induction was performed according to the standardized protocol14. After measurement of basal FEV1, all participants were treated with 200 µg of salbutamol (Ventolin; GlaxoSmithKline, Bredtfred, England). Four point five percent hypertonic saline solution was used to induce sputum production by using an ultrasonic nebulizer with output set at 4.5 mL/min (Omron Co., Tokyo, Japan), and this administration repeated up to 4 times at an interval of 5 minutes. After each nebulization, the subjects rinsed their mouths and spitted the sputum carefully into a Petri dish.
The induced sputum sample was mixed with the same amount of 10% dithiothreitol. The mixture was shaken, centrifuged, and crushed. In this study, we did not separate the sputum samples to the fluid phase or the cellular phase. DNA was then extracted from 400 µL of the whole sputum samples using Mixer Mill MM 300 (Retsch GmbH, Haan, Germany) and DNeasy Kit (Qiagen, Hilden, Germany) with 0.2-mm glass beads (250 mg) and two 5-mm metal beads.
3. Polymerase chain reaction amplification
The 16S rRNA gene from the bacterial DNA extracted from the whole sputum samples was amplified using polymerase chain reaction (PCR). The extracted DNA (100 ng) was used to obtain a PCR amplified product about 920 bp in size using the following primers: forward, 5'-AGAGTTTGATCMTGGCTCAG-3' labeled with 6-carboxyfluorescein at the 5' end; reverse, 5'-CCGTCAATTCMTTTRAGTTT-3'. A GeneAmp 9700 system (Applied Biosystems, Foster City, CA, USA) was used; a 50-µL reaction mixture was prepared for each sample using 5 µL Taq buffer (20 mM MgCl2 is contained), 0.5 µM forward primer, 0.6 µM reverse primer, 0.2 mM dNTP, 0.7 mg/mL bovine serum albumin (New England Biolabs, Beverly, MA, USA), 2 U ExTaq HS (TaKaRa, Tokyo, Japan), 100 ng template DNA, and sterile distilled water. The cycling conditions were 1 minute at 95℃, 30 seconds at 97℃, 32 cycles of 30 seconds at 97℃, 20 seconds at 58℃, and 90 seconds at 72℃. The amount of amplified DNA through three-time PCR repetition using identical conditions was measured with the help of an EPOCH spectrophotometer (BioTek Instruments Inc., Winooski, VT, USA). The formation of the specific product was verified by gel electrophoresis.
4. Terminal restriction fragment length polymorphism profiling
Terminal restriction fragment length polymorphism (T-RFLP) was performed as described previously15161718. Briefly, four restriction enzymes (ApoI, HhaI, NlaIV, and Hpy166II), suitable for the analysis of respiratory bacterial pathogens, and the Restriction Enzyme Picker (REPK) Online version 1.3 (http://rocaplab.ocean.washington.edu/tools/repk) were used for the profiling. The PCR products (200 ng) were added to the four restriction endonucleases at 37℃ for 2 hours (HhaI, NlaIV, and Hpy166II) or at 50℃ for 2 hours (ApoI). The mixture was then incubated at 65℃ (HhaI, NlaIV, and Hpy166II) or at 80℃ for 20 minutes and then stopped. The size of the fragmented T-RF gene was analyzed using capillary electrophoresis and an ABI PRISM 3130 genetic analyzer (Applied Biosystems). The fragment sizes were estimated using the Local Southern Method in GENESCAN 3.1 software (Applied Biosystems Japan, Tokyo, Japan). Based on the positive control bacterial DNAs (12 DNAs), GeneScan LIZ 1200 Size Standards were recalibrated. An operational taxonomic unit (OTU) was determined using T-REX software (http://trex.biohpc.org/, Cornell University), and the relative amounts of each OTUs were measured. The representative bacterial species or taxonomically related groups in the sputum were predicted using the T-RF size information from the T-RFLP database (http://mededu.cau.ac.kr/micro/FRETS.asp) created in this study.
5. Statistical analysis
The OTUs obtained from whole induced sputum samples were analyzed using multivariate statistical techniques with the software PRIMER (Plymouth Routines In Multivariate Ecological Research) version 6 (PRIMER-E Ltd., Plymouth, UK). T-RF data were subjected to multivariate analysis, including biodiversity analysis, analysis of similarity (ANOSIM), cluster analysis including hierarchal clustering analysis and non-metric multidimensional scaling (nMDS) and similarity percentage (SIMPER).
Biodiversity of each sample was measured by the Shannon-Weiner diversity index, while differences in biodiversity between asthma group and normal control group were assessed by a nonparametric Mann-Whitney test. Using ANOSIM, we assessed the similarities between the healthy controls group and the asthma patients group. The R statistic value describes the extent of similarity between each groups in the ANOSIM, which R=1 indicates that the two groups are entirely separate, while R=0 signifies that there is no difference between the groups. The contribution of specific T-RFs to differences in bacterial composition between groups was assessed. These statistical analyses were performed to determine whether there was a difference in the bacterial composition of the airways between the healthy controls and the asthma patients by SIMPER, and quantitative difference analysis was performed for the identification of specific T-RFs contributing to differences in bacterial composition between groups. Statistical significance was defined as a p-value of less than 0.05.
6. Ethics statement
This study was approved by the Institutional Review Board of Chung-Ang University Hospital and was performed with patients' consents (C2014056(1252)).
Results
1. Characteristics of the study subjects
The mean age of the asthma patients was 62.0±14.8 years; 47.2% of the subjects were males, 60.7% were non-smokers, and 39.3% were ex-smokers (Table 1). The mean FEV1 predicted was 82.0±17.2%, and PC20 was 10.9±8.1 mg/mL. In the control group, the mean age of the 36 subjects was 32.2±10.3 years, and 47.2% were male, 88.9% were non-smokers, and 11.1% ex-smokers. The mean FEV1 predicted was 100.8±10.3%.

Characteristics of the study subjects with asthma
2. Comparison of microbiota in the sputum samples
The Shannon index was used to evaluate the intra-group diversity in the sputum samples of the two groups; it was 3.5±0.3 in the control group and 3.5±0.3 in the asthma group, showing no significant difference in diversity between the two groups (p=0.807) (Figure 1).

Diversity of microbiota profile in the healthy control and asthma groups. Diversity of microbiota did not show a distinction between healthy controls and asthma patients (p=0.937).
There was no marked difference between the compositions of the microbial communities in the sputum samples of the two groups, when analyzed at the phylum level (Table 2). For the phylum Firmicutes, the prevalence was 46.4% in the control group and 44.2% in the asthma group. Further, Proteobacteria and Bacteroides showed a prevalence of 14.5% and 10.8% in the control group and 16.0% and 11.6% in the asthma group, respectively.

Microbial composition at the phylum level
3. Dissimilarity between the controls and asthma patients
The results of the ANOSIM test indicated that the bacterial composition in the two groups was different as the global R-value was 0.148, with a p-value of 0.002 (Figure 2). The SIMPER of the bacterial communities in the sputum samples of the control and the asthma groups was calculated using SIMPER, and the average dissimilarity between the bacterial communities of the two groups was 28.74%. Hierarchal clustering analysis (Figure 3) or nMDS (Figure 4) indicated no distinct difference in the OTUs for the sputum samples of the two groups.

Analysis of similarity test for global community composition (ANOSIM test). Microbial composition showed a significant difference between healthy controls and asthma patients (Global R value=0.148, p=0.002).

Cluster analysis. Hierarchical cluster analysis indicated no distinct difference in the operational taxonomic units in the sputum samples between the two groups.
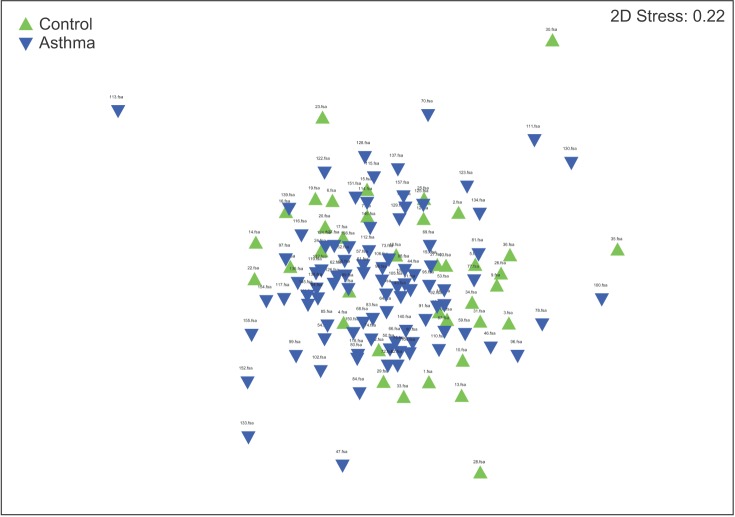
Nonmetric multidimensional scaling (nMDS). nMDS indicated no distinct difference in the operational taxonomic units in the sputum samples between the two groups.
4. OTUs contributing to the dissimilarity between the control and asthma groups
OTUs accounting for the top 50% contribution to the dissimilarities in the bacterial communities between the two groups are presented in Appendix 1. OTUs 492, 805, 361, 375, 198, 661, 789, 743, 658, and 598 accounted for the top 10%.
As shown in Figure 5, nine OTUs showed more than 1.5 times the amount of bacteria in the induced sputum samples of the asthma group as compared to that in the control group. Particularly, OTU 789 showed 3.1 times more bacteria in the asthma group than in the control group, and belonged to Lachnospiraceae, Alteromonadaceae, Methylococcaceae, Moraxellaceae, and Pseudomonadaceae. Both OTU 517 (Rhizobiales, Rhodospirillales, and Comamonadaceae) and OTU 633 (Prevotella) showed 1.9 times more abundant in the asthma group than in the control group. In addition, OTU 645 (Actinobacteria, Propionibacterium acnes; 1.8-fold), 607 (Lactobacillus buchneri, Lactobacillus otakiensis, Lactobacillus sunkii, Rhodobacteraceae; 1.8-fold), 661 (Acinetobacter, Pseudomonas, Leptotrichiaceae; 1.8-fold), 650 (Brevibacteriaceae, Lachnospiraceae, Fusobacterium; 1.5-fold), 821 (Lachnospiraceae, Acinetobacter, Actinomyces; 1.5-fold), 415 (Comamonadaceae, Streptomycetaceae; 1.5-fold) were significantly more prevalent in the sputum of asthma patients than normal control. On the contrary, only OTU 598, belonging to Lactobacillaceae and Bacteroidales, showed 1.9 times more abundant in the control group than in the asthma group.
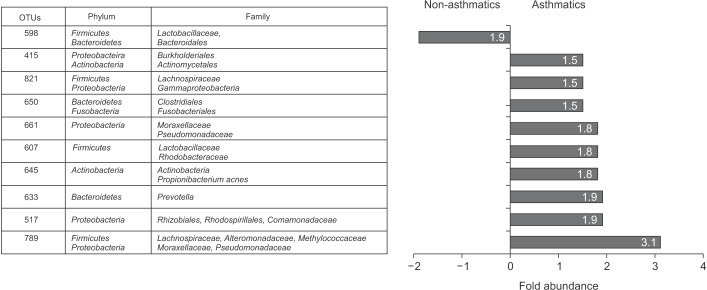
Operational taxonomic units (OTUs) with at least 1.5-fold differences in sputum microbiota between the controls and asthma patients and fold abundance.
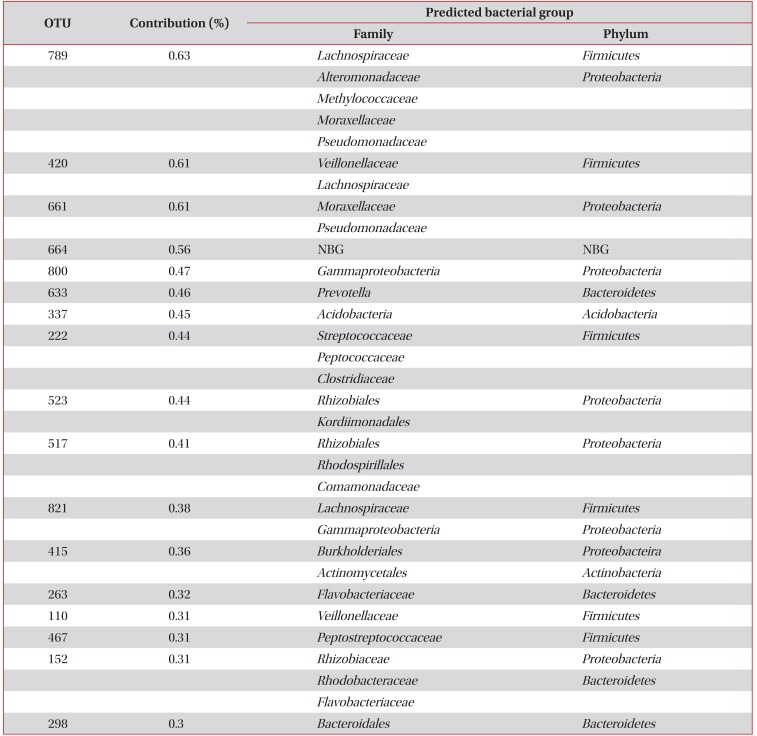
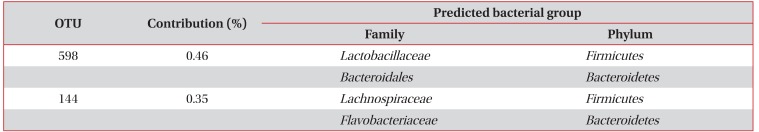
As shown in Table 3, 17 OTUs including OTUs 789, 420, 661, 664, 808, 633, 337, 222, 523, 517, 821, 415, 263, 110, 467, 152, and 298, contributed to 90% of the induced sputum microbiota in the asthma patients but not in the healthy controls. In addition, OTUs 528 and 144 contributed to 90% of the induced sputum microbiota in healthy controls but not in the asthma patients (Table 4).

OTUs existing in 90% of the induced sputum microbiota in asthma patients, but not found in healthy controls

OTUs existing in 90% of the induced sputum microbiota in healthy controls, but not found in asthma patients
Discussion
The application of culture-independent tools for identification of microbes has been changing concepts of pathogenesis in many diseases. The interests of microbiome research have expanded to the role of the airway microbiome in asthma which is still largely unknown about its predisposition and development. There are some evidence suggesting the microbiome of the airways differs distinctly in patients with asthma from healthy subjects1112. However, evidences from recent studies are still inconclusive.
In this study, we compared the microbiome in induced whole sputum samples representing the airways of steroid naїve asthma patients with those of healthy subjects using T-RFLP and we expanded sample size compared to previous studies. The diversity and the bacterial composition at the phylum level in the asthma group were not significantly different from that in the control group. However, there was a slight but significant difference of OTUs in the composition of microbiome community between the two groups. In addition, OTUs showed differences in the relative amounts of certain bacteria between the two groups; there were also some OTUs representing bacteria found only in one group, indicating a difference in the microbiome of the airway between asthma patients and healthy controls.
In previous metagenomics studies on asthma, the small number of study subjects fewer than 30 was the main obstacle to reach a conclusion. To overcome this, we expanded the sample size to 135 subjects, larger than any previous studies conducted. T-RFLP is a fingerprinting method and has a limitation in the range of microbiota. However, T-RFLP technique can be useful clustering communities according to changes in the dominant members across large number of samples. There are several microbiome studies using T-RFLP in humans and those mainly focused on inflammatory bowel disease and irritable bowel syndrome with fecal microbiota1718192021 but some studies dealt with cystic fibrosis2223 and asthma10.
In this study, we used whole sputum obtained through induction. Previously, researchers investigated the microbial composition in the BAL fluid, bronchial epithelial brushings, and the lung tissue. The limitation of these studies was that these samples could not be easily obtained. Thus, induced sputum samples, relatively less invasive and easy to acquire, were used in this study. Only a few previous metagenomics studies using inducted sputum samples have already shown significant results in asthma patients101112. Moreover, studies involving an investigation of the microbiome of the oropharynx in asthma patients have shown significant results2425. Another study reported that similar bacteria are distributed from the oral cavity to the lungs26. It is postulated that the induced sputum samples in this study can sufficiently reflect the airway of asthma patients. However, in previous studies, microbiome studies have been performed only with induced sputum cell pellets or supernatants after in cytospin preparations101112 and an appropriate sputum sample for studying lung microbiome in the airway of asthmatics is not established yet. A study on feces in the colon reported that there is a difference between the bacterial flora in the intestinal epithelium and the bacterial flora in the feces18. Furthermore, quantitative differences exist in specific bacterial groups between luminal and mucosal-associated intestinal microbiota using two independent techniques such as culture analysis and DNA study27. Therefore, microbiome analysis using the whole sputum sample including both the cellular and the fluid phases of the sputum should be compared that from supernatants of sputum. In addition, genetic, dietary factors and socioeconomic status can affect microbiota in human28. In this study, considering that all study subjects were Koreans, genetic and dietary factors would be relatively homogeneous but may contribute and alter lung microbiota compared to other ethnic groups.
With regard to the diversity of the bacteria, researchers have reported that the diversity of the gut microbiome decreases immediately after birth and that it is associated with the development of asthma and its severity293031. The decreased diversity of the microbiome can increase the risk of asthma and allergic disease(s) and it is consisting with hygiene hypothesis. In addition, the reduced diversity of the microbiome in neutrophilic asthma among poorly controlled asthmas has been reported12. However, some researchers have reported the diversity to be rather significantly higher in asthma patients than in controls, and that it is associated with AHR1132, while it has been reported that there was no difference in the diversity based on the absence or presence of asthma2533. In this study, no distinctive difference was found in the diversity between the control group and the asthma group.
Several metagenomics studies have reported that the airway of asthma patients is represented with an increase of the number of proteobacterial species, which is a different characteristic from that observed in healthy people11253435. In addition, it has been reported that Bacteroidetes species are more common in healthy controls than in asthma patients2533 and other studies have reported that Acinetobacteria and Firmicutes exist at a greater proportion in the control group11. This discrepancy may be attributed from the limited number of study subjects included in the studies in part. In addition, the difference in the bacterial numbers at the phylum level, consisted of a number of species, can result in opposing findings. This study was performed in a large number of subjects but we could not find significant difference in the bacterial community composition at the phylum level between the two groups. However, considering the 12% of unidentified bacteria and 8% of OTUs representing two phyla as a partial limitation of the T-RFLP method used in this study, the chance of false negative results cannot be ruled out. However, for the OTUs showing a significant difference between the two groups in this study, the number of Proteobacteria was much greater in the asthma group than in the control group, and the proportion of Bacteroidetes was higher in the control group. In particular, among bacteria found only in the asthma group, the OTUs representing Proteobacteria tended to be relatively greater and the OTUs observed only in the healthy controls all belonged to Bacteroidetes.
Green et al.10 reported that Moraxella catarrhalis, and members of the Haemophilus or Streptococcus genera are the major bacteria in treatment-resistant patients with severe asthma, and a greater ratio of these bacteria is associated with reduced FEV1, increased neutrophil count, and increased interleukin 8 expression, indicating that the composition of the bacterial community is associated with the severity of asthma. In addition, one previous study has also reported that Comamonadaceae, Sphingomonadaceae, and Oxalobacteraceae, which belong to the phylum Proteobacteria, are associated with bronchial hypersensitivity32. In agreement with this result, we found that OTU 789 in Moraxellaceae showed a 3.1-times higher prevalence in the asthma group than in the control group, OTU 517 representing Comamonadaceae showed a 1.5 times higher prevalence in the asthma group.
A major limitation of this study is that the age of healthy control group is much lower than that of the asthma group. This was caused by recruitment of subjects without age matching. Study about aging and lung microbial change is rare36. Instead, studies from gut microbiome showed that age affect the microbiome profile and age related changes to the intestinal microbiome influence asthma3738. The environment of the lung microbiome can also change according to aging36. Therefore, further studies would need to be performed with age matching. In other limitation, there were many unidentified bacteria as this study used T-RFLP, a fingerprint method. However, T-RFLP method is still being used before applying to next generation sequencing (NGS) owing to its several advantages over sequencing methods. T-RFLP method is a highly robust, easy to handle and a cheap alternative to the computationally demanding NGS analysis. In addition, T-RFLP method used in this study was tailored for the respiratory tract bacteria by in-silico testing the common bacteria residents in the respiratory tract and the four best restriction enzymes was chosen prior to performing the T-RFLP procedures in order to overcome the limitation of T-RFLP.
In conclusion, this study, unlike previous studies, involved the investigation of the microbiome in whole sputum samples of asthma patients using T-RFLP in a relatively larger sample size and the microbial composition in airway could not be clearly divided according to the presence of asthma.
Acknowledgements
This study was supported by 2014 research fund of Korean Academy of Tuberculosis and Respiratory Diseases.
Notes
Conflicts of Interest: No potential conflict of interest relevant to this article was reported.
Appendix
Appendix 1
Contribution of OTUs to the dissimilarity in microbial communities in the induced sputum between controls and asthma patients
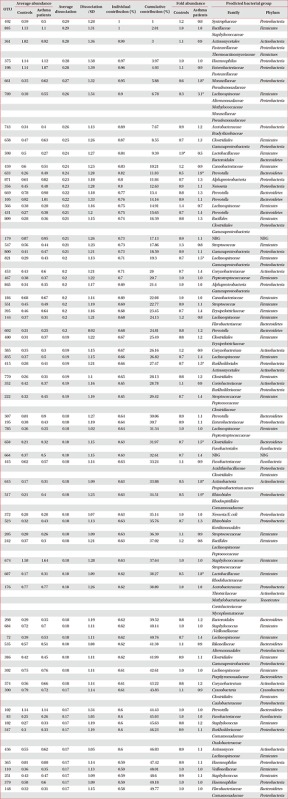
*More than twice the difference between the two groups.
OTU: operational taxonomic unit; SD: standard deviation; NBG: numerous bacterial groups.