Effects of Particulate Matter 10 Inhalation on Lung Tissue RNA expression in a Murine Model
Article information
Abstract
Background
Particulate matter 10 (PM10; airborne particles <10 μm) inhalation has been demonstrated to induce airway and lung diseases. In this study, we investigate the effects of PM10 inhalation on RNA expression in lung tissues using a murine model.
Methods
Female BALB/c mice were affected with PM10, ovalbumin (OVA), or both OVA and PM10. PM10 was administered intranasally while OVA was both intraperitoneally injected and intranasally administered. Treatments occurred 4 times over a 2-week period. Two days after the final challenges, mice were sacrificed. Full RNA sequencing using lung homogenates was conducted.
Results
While PM10 did not induce cell proliferation in bronchoalveolar fluid or lead to airway hyper-responsiveness, it did cause airway inflammation and lung fibrosis. Levels of interleukin 1β, tumor necrosis factor-α, and transforming growth factor-β in lung homogenates were significantly elevated in the PM10-treated group, compared to the control group. The PM10 group also showed increased RNA expression of Rn45a, Snord22, Atp6v0c-ps2, Snora28, Snord15b, Snora70, and Mmp12. Generally, genes associated with RNA splicing, DNA repair, the inflammatory response, the immune response, cell death, and apoptotic processes were highly expressed in the PM10-treated group. The OVA/PM10 treatment did not produce greater effects than OVA alone. However, the OVA/PM10-treated group did show increased RNA expression of Clca1, Snord22, Retnla, Prg2, Tff2, Atp6v0c-ps2, and Fcgbp when compared to the control groups. These genes are associated with RNA splicing, DNA repair, the inflammatory response, and the immune response.
Conclusion
Inhalation of PM10 extensively altered RNA expression while also inducing cellular inflammation, fibrosis, and increased inflammatory cytokines in this murine mouse model.
Introduction
Air pollution is an important problem worldwide, and it certainly has negative effects on general health [1-3]. Particulate matter 10 (<10 μm; PM10) is a one of the major components of air pollution. It includes high levels of elements such as silicon, barium, aluminum, zinc, copper, and lead [4,5]. PM10 enters the airway through the nose and mouth, and as a result it can potentially cause injury to the respiratory tract, including the trachea, bronchus, alveoli, and even lung parenchyma. Studies have also indicated that chronic and intensive inhalation of PM10 can induce and enhance airway and lung diseases. For example, epidemiologic data have shown that asthma can be developed and aggravated by ambient pollutants like PM10 [6-8], and chronic obstructive pulmonary disease (COPD) is also sensitive to PM10 exposure [9-12].
Some indications of the mechanisms underlying these effects have been found [13]. For example, innate and adaptive immune responses in the airway and lung can be altered by extrinsic irritants in general [14], and PM10 exposure can alter mechanical and immunological barriers in airway disease [15]. At the molecular level, evidence indicates that interleukin (IL)-1β, IL-6, NOD-like receptor pyrin domain-containning protein 3, and chemokine (C-C motif) ligand 20 may be key mediators of the effects of PM10 on airway and lung tissue [16-18]. However, PM10 particles are extremely small and consist of variable elements. We therefore hypothesized that PM10 can alter RNA expression in extensive range, potentially leading to visible inflammation and other side effects. Elucidating the patterns of RNA expression changes in response to PM10 in a murine model may be helpful for predicting its effects on human health.
Materials and Methods
1. Animal model designs
Female BALB/c mice, between 5 and 6 weeks old (Orient, Daejeon, Korea), were maintained at conventional animal facilities under pathogen-free conditions, and five mice were assigned in each group. To establish the PM10-induced murine model (PM10 model), PM10 (ERMCZ-120 certified reference material; Sigma-Aldrich, St. Louis, MO, USA; 100 μg [PM100] or 200 μg [PM200]) suspended in 20 μL normal saline was intranasally administered four times over 2 weeks. To establish the ovalbumin (OVA)-induced asthma murine model (OVA model), mice were sensitized with 20 μg OVA (Sigma-Aldrich) suspended in 1% aluminum hydroxide (Resorptar; Indergen, New York, NY, USA) by intraperitoneal injection on days 1 and 14. On days 21, 22, and 23, the OVA-sensitized mice were challenged intranasally with 30 µL of OVA (1 mg/mL) in saline solution. An OVA/PM10-treated model was established by the above two treatments simultaneously. All mice were sacrificed 2 days after their last treatment (Supplementary Figure S1). All experimental procedures of mice studies were approved by the Institutional Animal Care and Use Committee, Animal Research Ethics Board of Yonsei University (Seoul, Korea) (IACUC approval number, 2020-0087) and were performed in accordance with the Committee’s guidelines and regulations for animal care.
2. Measurement of airway hyper-responsiveness
Airway hyper-responsiveness (AHR) to inhaled aerosolized methacholine (MCh; Sigma-Aldrich) was measured using a forced oscillation technique (FlexiVent; SCIREQ, Montreal, QC, Canada) on the sacrifice day, as described in a previous study [19-21]. Aerosolized phosphate-buffered saline or MCh at varying concentrations (3.125 mg/mL, 6.25 mg/mL, 12.5 mg/mL, 25.0 mg/mL, or 50.0 mg/mL), was administered to mice for 10 s via a nebulizer connected to a ventilator. Then, AHR was assessed by measurements of airway resistance.
3. Inflammatory cell counting in bronchoalveolar lavage fluid
To collect bronchoalveolar lavage fluid (BALF), we performed lung lavage, using 1 mL of Hank’s balanced salt solution (HBSS) through a tracheal tube. The recovered BALF was centrifuged and resuspended in 300 µL HBSS. Total cell numbers were determined using a hemocytometer and trypan blue staining. BALF cells were centrifuged by cytocentrifugation (Cytospin 3; Thermo Fisher Scientific, Waltham, MA, USA) and were pelleted to cytospin slides. The slides were stained with hematoxylin and eosin (H&E Hemacolor; Merck, Darmstadt, Germany) and a differential count of inflammatory cells was performed (200 cells per slide).
4. Histological analysis
The lung that was not used for BALF collection was fixed in 4% formalin and embedded in paraffin. Lung sections were cut into 3–4-µm-thick slices and stained with H&E, periodic acid-Schiff, and Masson trichrome (M&T) for histological analysis. The slides were observed under a light microscope (×200 magnification). Fibrosis area was measured by estimating the color-pixel count over the pre-set threshold color on M&T-stained slides at ×200 magnification using MetaMorph program (Molecular Devices, Sunnyvale, CA, USA).
5. Lung homogenate
After collecting BALF, remaining lung tissue was resected and homogenized using a tissue homogenizer (Biospec Products, Bartlesville, OK, USA) in lysis buffer and protease inhibitor solution (Sigma-Aldrich). After incubation and centrifugation, supernatants were harvested and passed through a 0.45-micron filter (Gelman Science, Ann Arbor, MI, USA). The final preparations were stored at –20°C for cytokine analysis as described previously [19].
6. Analysis of cytokines
Concentrations of interleukin (IL)-1β, tumor necrosis factor-α (TNF-α), IL-13, and transforming growth factor-β (TGF-β) in lung homogenates were assessed by enzymelinked immunosorbent assay (R&D Systems, San Diego, CA, USA) according to the manufacturer’s instructions. All samples were assessed in duplicate.
7. Full RNA sequencing
Total RNA was extracted from lung tissue using Trizol reagent (Invitrogen, Carlsbad, CA, USA). The isolated mRNAs were used for cDNA synthesis. Libraries were prepared using the NEBNext Ultra II Directional RNA Seq Kit (New England BioLabs, Inc., Hitchin, UK). Indexing was performed using the Illumina indexes 1–12. The enrichment step was carried out using polymerase chain reaction (PCR). Subsequently, libraries were checked using the Agilent 2100 bioanalyzer (Agilent Technologies, Amstelveen, The Netherlands), to evaluate the mean fragment size. Quantification was performed using the library quantification kit with an ND 2000 Spectrophotometer (Thermo Fisher Scientific) and StepOne Real Time PCR System (Life Technologies, Inc., Carlsbad, CA, USA). High-throughput sequencing was performed as paired end 100 sequencing using NovaSeq 6000 (Illumina, Inc., San Diego, CA, USA).
Quality control of raw sequencing data was performed using FastQC (Simon, 2010). The results of fast QC are presented in Supplementary Figure S2. Adapter and low-quality reads (<Q20) were removed using FASTX_Trimmer (Hannon Lab, 2014) and BBMap (Bushnell, 2014). Then, the trimmed reads were mapped to the reference genome using TopHat [22]. Gene expression levels were estimated by calculating fragments per kb per million reads (FPKM) using Cufflinks [23]. The FPKM values were normalized based on a quantile normalization method using EdgeR within R (R development Core Team, 2016). Data mining and graphic visualization including define upregulated or downregulated gene expression were performed using ExDEGA (E-Biogen, Inc., Seoul, Korea).
8. Statistical analysis
All results are expressed as the mean±standard error. The AHR data were analyzed using repeated-measure analysis of variance (ANOVA), followed by a post-hoc Bonferroni test. One-way ANOVA was performed to assess the significance of differences in BALF cell count, cytokine levels, and quantitative fibrosis among groups. All statistical analyses were performed with IBM SPSS version 18.0 (SPSS Inc., Chicago, IL, USA). p-values <0.05 were considered statistically significant.
Results
1. Comparison of weight changes, AHR, and BALF between control and PM10-treated groups
All mice increased in weight over the course of the experiment. There was a non-significant trend for the PM10-treated group (PM100 and PM200) to gain less weight (Figure 1A). AHR obtained by MCh challenge showed no significant changes among the three groups (Figure 1B). BALF cell counts were also not significantly different among groups (Figure 1C).
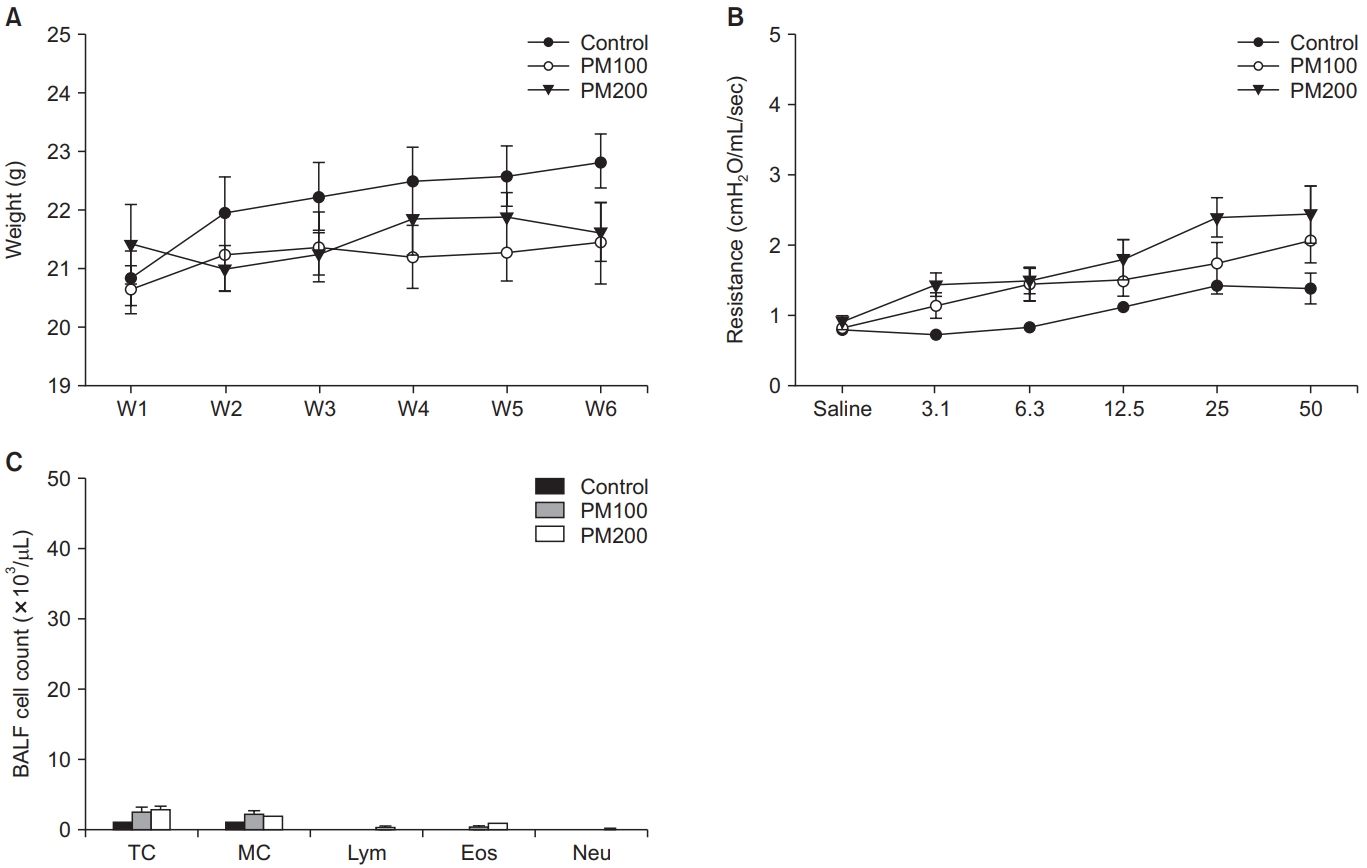
(A) Weight change did not significantly differ among groups. (B) Airway hyper-responsiveness as determined by methacholine challenge showed no significant difference among groups. (C) There were no significant differences in the BALF cell counts between groups. BALF: bronchoalveolar lavage fluid; PM: particulate matter; TC: total cell; MC: macrophage; Lym: lymphocyte; Eos: eosinophil; Neu: neutrophil.
2. Comparison of pathologic findings between control and PM10-treated groups
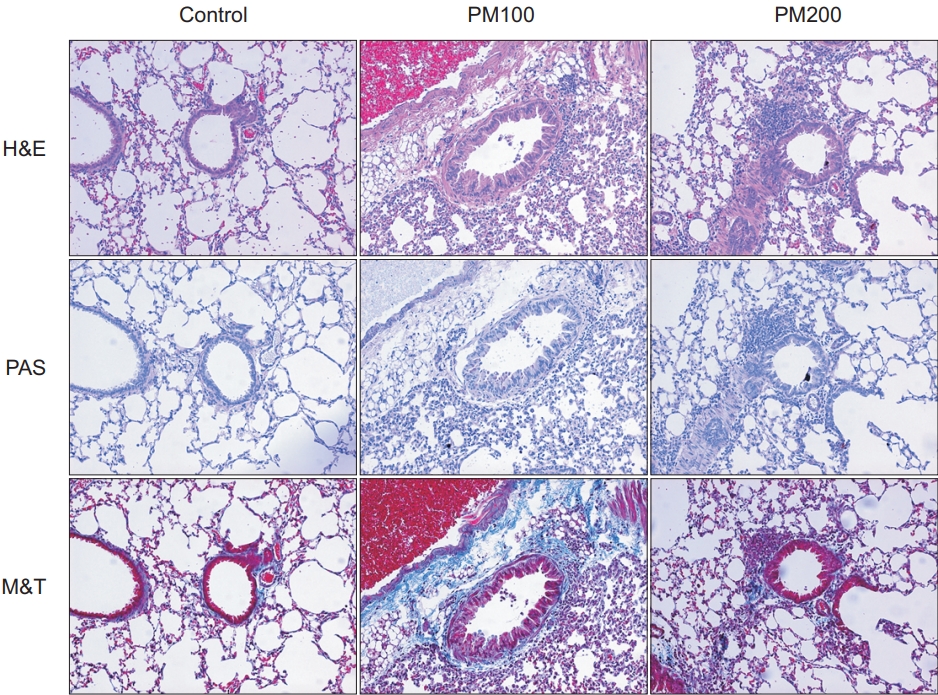
Compared to the control group, the PM10-treated group (PM100 and PM200) showed cellular infiltration in the airway and lung parenchyme. Airway wall thickness, goblet cell hyperplasia, and inflammatory cellular proliferation were observed predominantly in the PM10-treated group. In addition, fibrosis in lung parenchyme and peribronchial tissues were also predominant in the PM10-treated group, compared to the control group (Figure 2).
3. Comparison of cytokine levels in lung homogenates and quantitative fibrosis between the control and PM10-treated groups
The levels of IL-1β, TNF-α, and TGF-β in lung homogenates were higher in the PM10-treated group than in the control group, but statistical significance was observed only for the PM100 group (Figure 3A–C). As evidence by the results of the fibrosis-area analysis, PM10 induced significant lung fibrosis (Figure 3D).

IL-1β (A), TNF-α (B), and TGF-β (C) levels in lung homogenates were significantly higher in the PM100-treated group compared to the control group. Quantitative fibrosis was significant and severe in the PM10-treated group compared to the control group (D). IL-1β: interleukin 1β; PM: particulate matter; TNF-α: tumor necrosis factor-α; TGF-β: transforming growth factor-β. *p<0.05.
4. Comparison of RNA expression between the control and PM10-treated groups
The PM10 model showed increased RNA expression of Rn45a, Snord22 (small nucleolar RNA), Atp6v0c-ps2 (ATPase, H+ transporting, lysosomal V0 subunit C, pseudogene 2), Snora28, Snord15b, Snora70, and Mmp12 compared to control group (Figure 4A). Generally, genes associated with RNA splicing, DNA repair, inflammatory response, immune response, cell death, and the apoptotic process were highly expressed in the PM10 model compared to control group (Figure 4B).
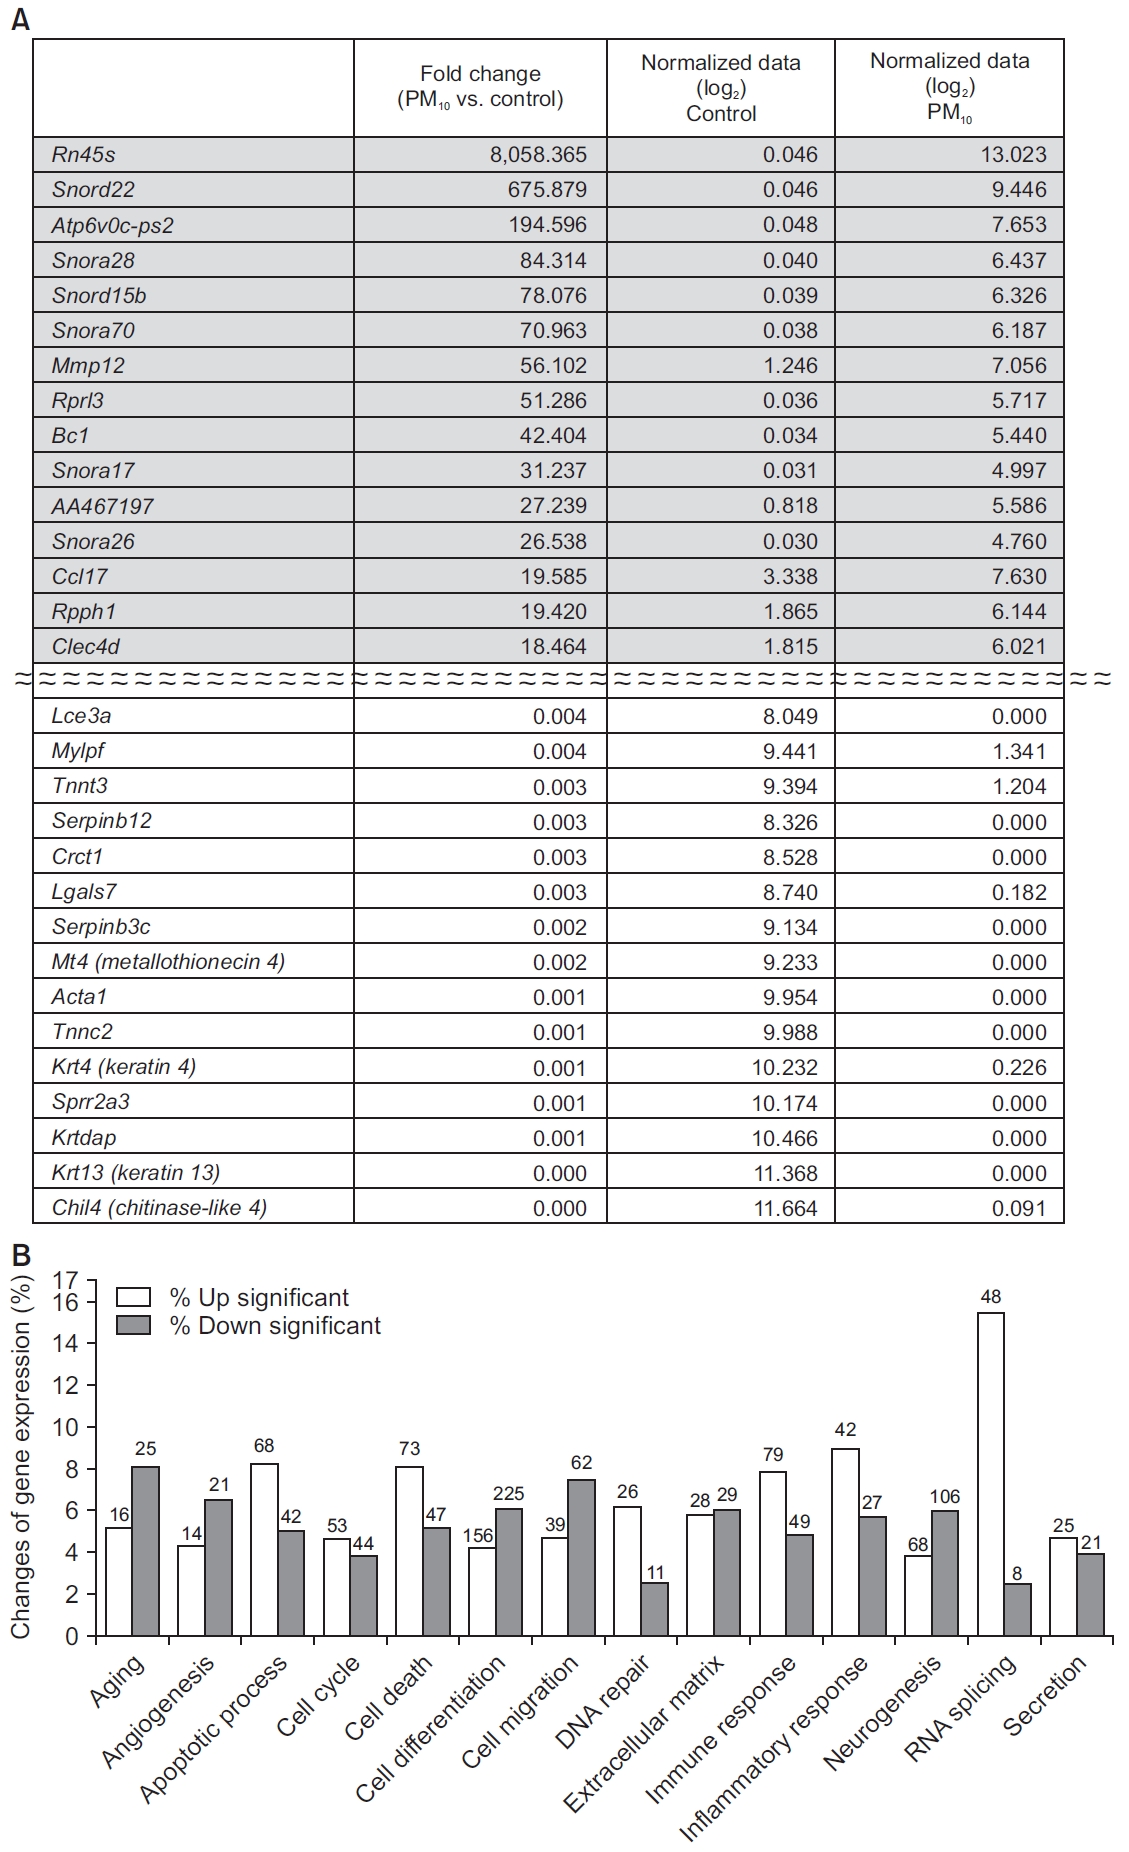
(A) Genes showing the largest difference between the control and PM10-treated groups. (B) RNA expression of genes associated with RNA splicing, DNA repair, the inflammatory response, the immune response, cell death, and apoptotic process were increased in the PM10-treated group compared to the control group. The number of genes with significant change are presented at the top of bar. PM: particulate matter.
5. Comparison of weight changes, airway hyper-responsiveness, and BALF cell count between the control, OVA, and OVA/PM10-treated groups
All mice increased in weight over the course of the experiment. Among all the groups, the final weight of the control group was the heaviest (Figure 5A). AHR obtained by MCh challenge in both OVA-treated groups (OVA and OVA/PM10) was predominant compared to the control group. However, it was not significantly different between the OVA and OVA/PM10-treated groups (Figure 5B). Total cell, macrophage, and eosinophil counts in BALF were highly elevated in all OVA-treated groups compared with the control group. However, they were not significantly different between the OVA and OVA/PM10-treated groups (Figure 5C).
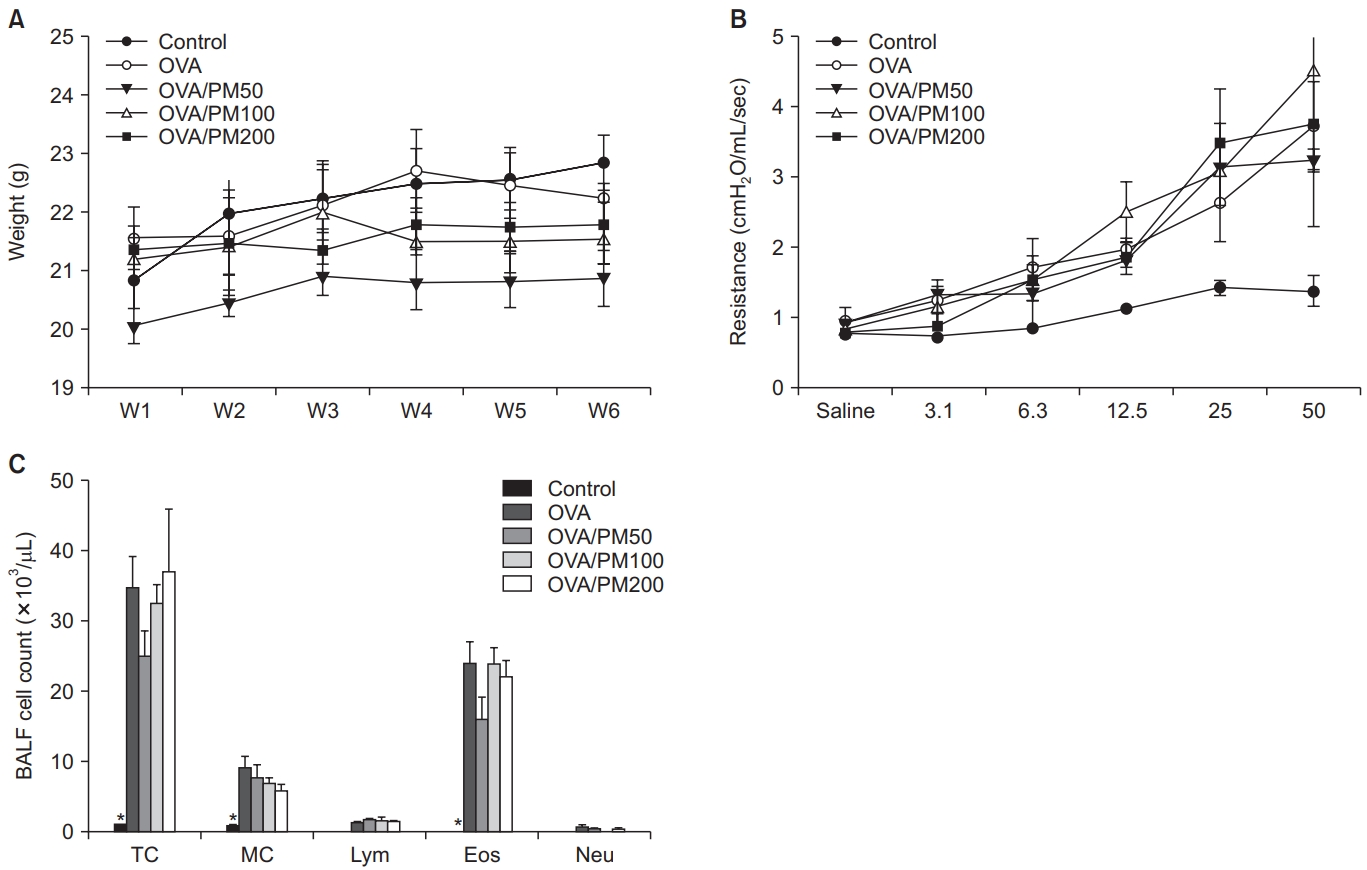
(A) Weight change was not significantly different among groups. (B) Airway hyper-responsiveness as determined by methacholine challenge were increased in the OVA and/or PM10-treated group. (C) BALF cell counts revealed significantly increased total macrophage and eosinophil counts in the both OVA and OVA/PM10-treated groups compared to the control group. BALF: bronchoalveolar lavage fluid; OVA: ovalbumin; PM: particulate matter; TC: total cell; MC: macrophage; Lym: lymphocyte; Eos: eosinophil; Neu: neutrophil. *p<0.05 between it and others.
6. Comparison of pathologic findings between control, OVA, and OVA/PM10-treated group
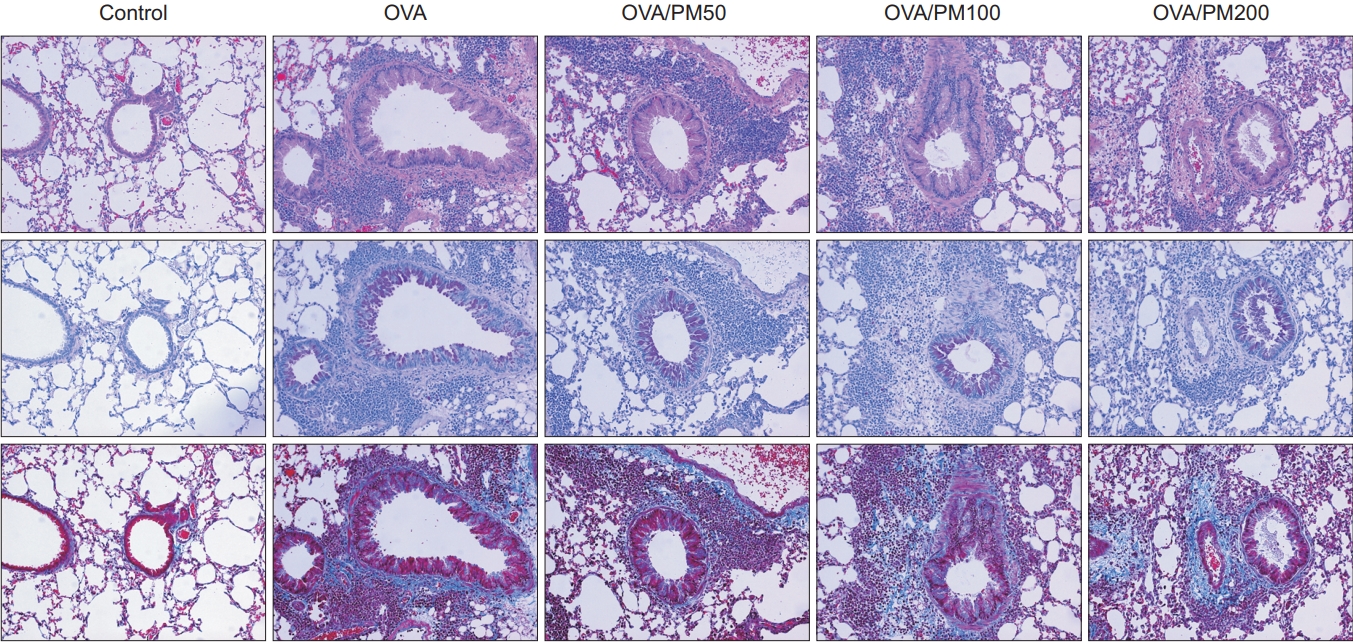
All OVA-treated groups showed prominent inflammatory cell proliferation and fibrosis in airway, peribronchial tissue, and lung parenchyme, compared to control group. However, treatment of OVA/PM10 did not have additive effect on OVA alone (Figure 6).
7. Comparison of cytokine levels in lung homogenates and quantitative fibrosis between in control, OVA, and OVA/PM10-treated group
The levels of IL-1β, TNF-α, IL-13, and TGF-β in lung homogenates were increased in the OVA-treated group. However, the effects of OVA/PM10 treatment were not greater than those of OVA alone (Figure 7A–D). Both OVA and OVA/PM10 treatment induced significant lung fibrosis as evident in fibrosisare analysis; however, OVA/PM10 treatment were not greater than those of OVA alone (Figure 7E).
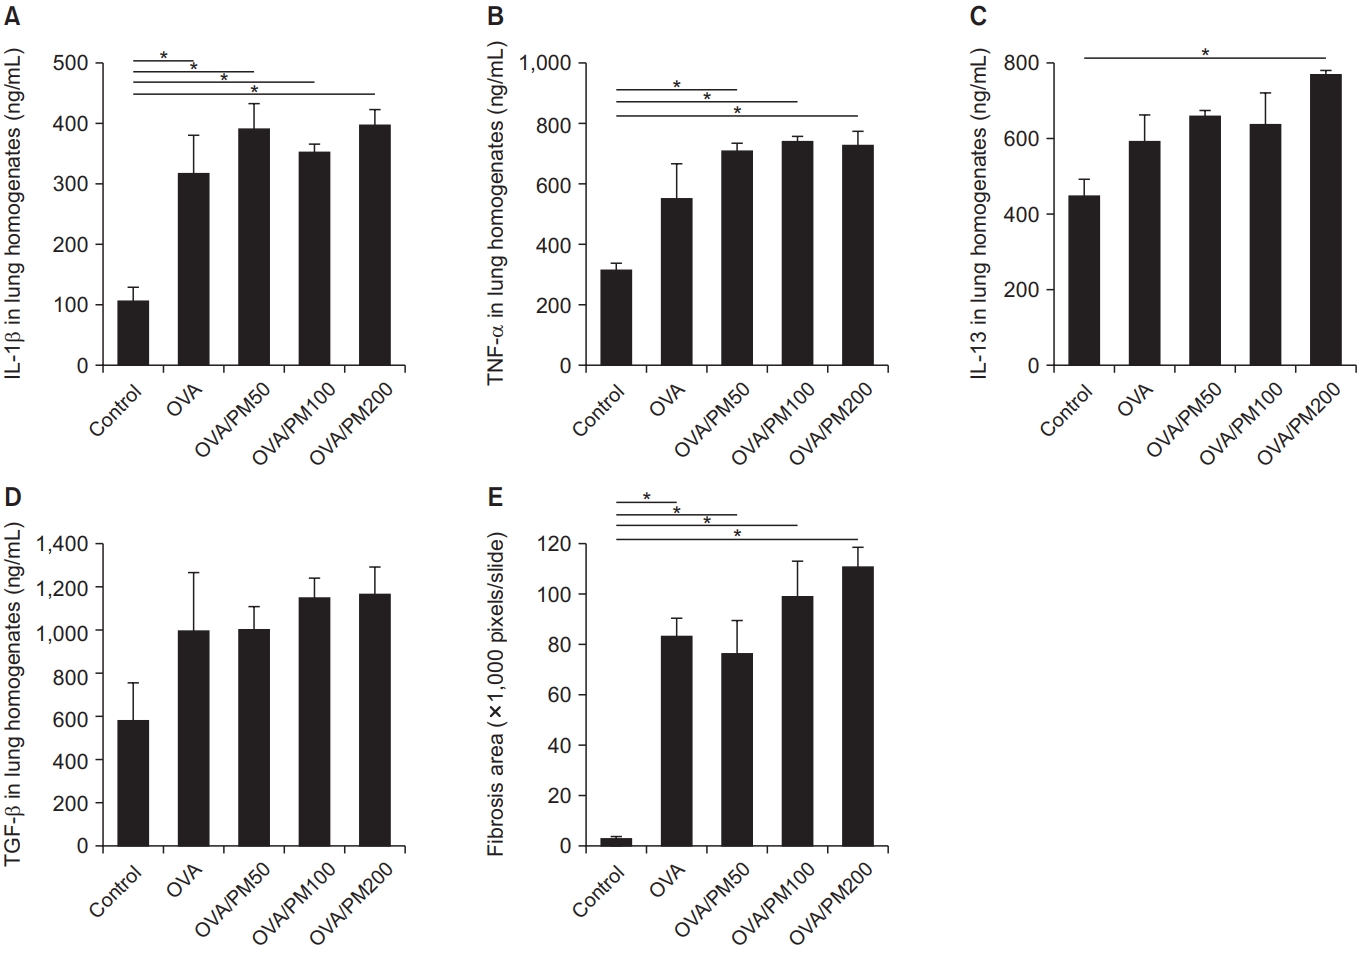
IL-1β (A), TNF-α (B), IL-13 (C), and TGF-β (D) levels in lung homogenates were increased in the OVA and OVA/PM10-treated groups. Quantitative fibrosis was significant and severe in the OVA and OVA/PM10-treated groups compared to the control group (E). IL: interleukin; OVA: ovalbumin; PM: particulate matter; TNF-α: tumor necrosis factor-α; TGF-β: transforming growth factor-β. *p<0.05.
8. Comparison of RNA expression between the control and OVA/PM10-treated groups
The OVA/PM10-treated model showed increased RNA expression of Clca1 (chloride channel accessory 1), Snord22, Retnla (resistin like alpha), Prg2 (proteoglycan 2, bone marrow), Tff2 (trefoil factor 2), Atp6v0c-ps2, and Fcgbp (Fc fragment of IgG binding protein) compared to the control (Figure 8A). Overall, this model showed increased RNA expression of genes associated with RNA splicing, DNA repair, inflammatory response, and immune response compared to control group (Figure 8B).
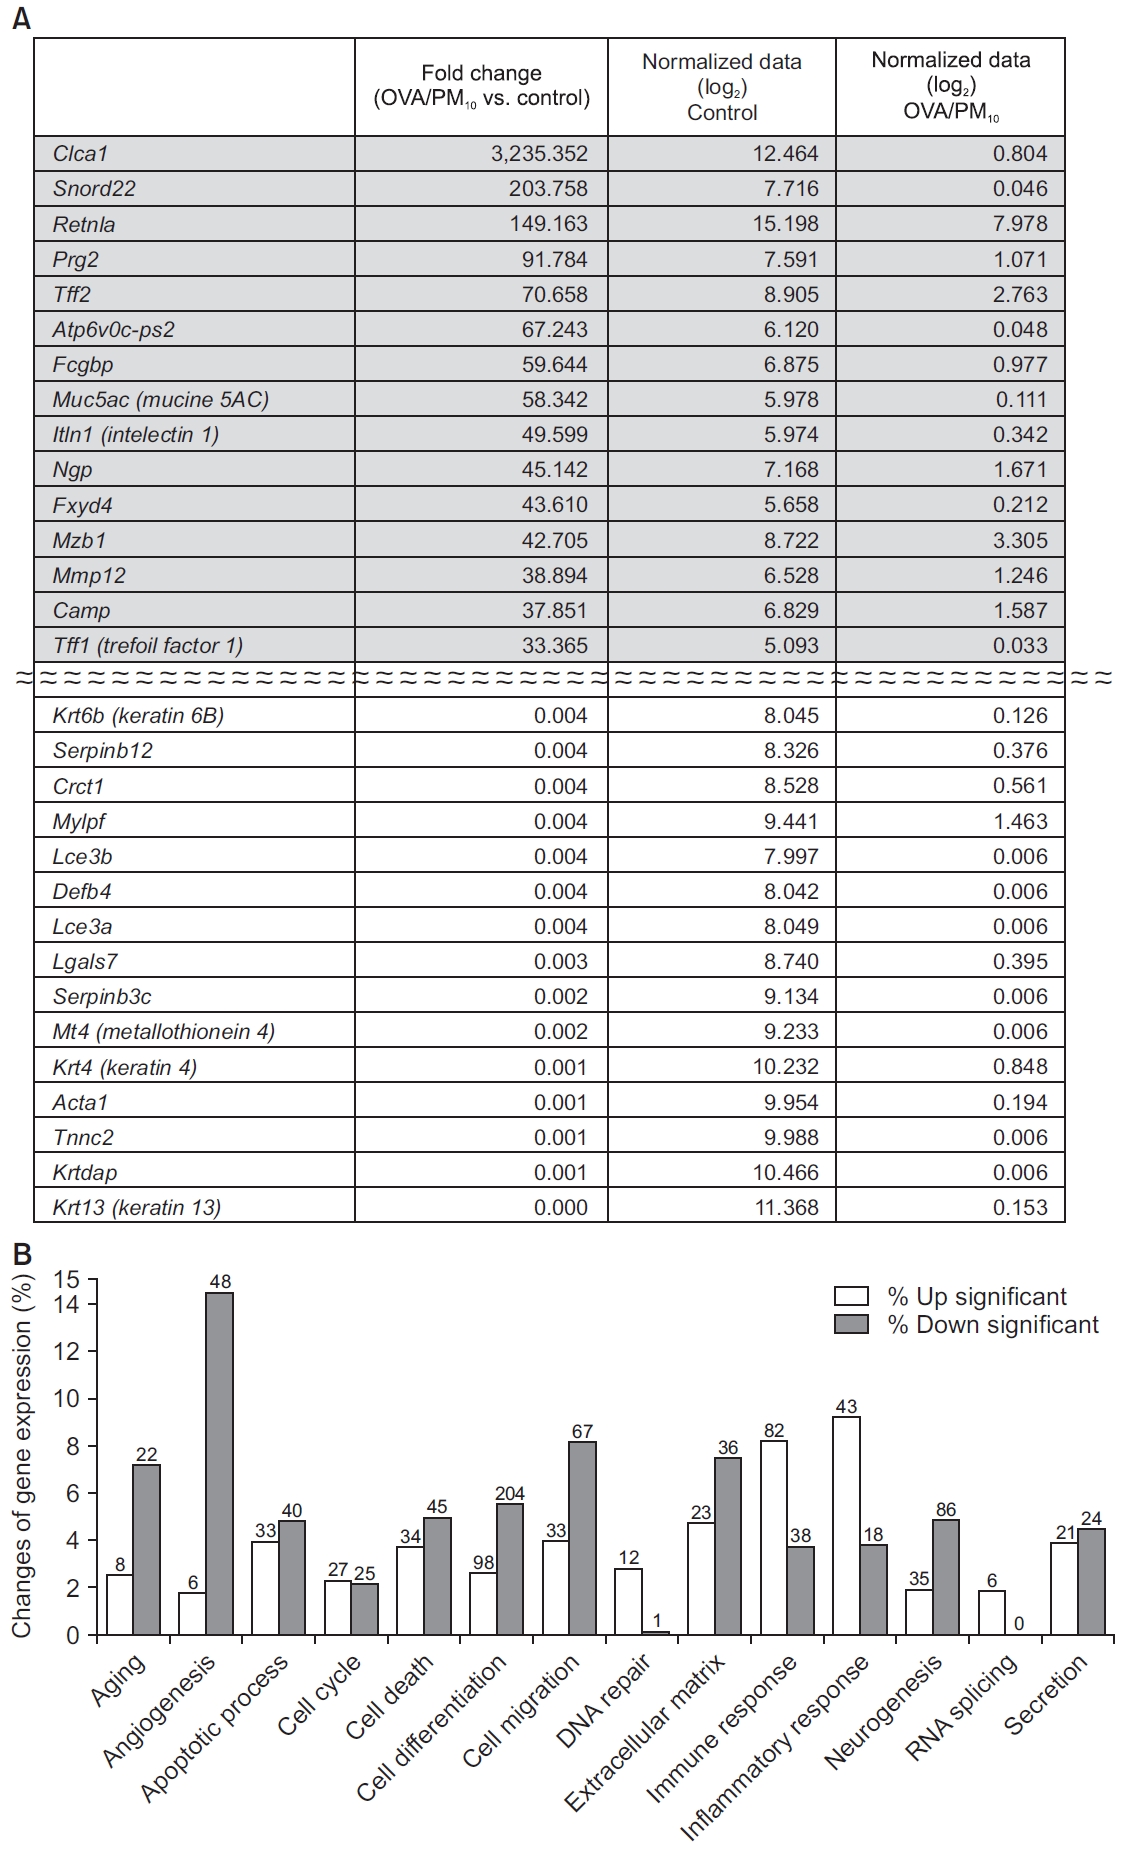
(A) Genes showing the largest difference between the control and OVA/PM10-treated groups. (B) RNA expression of genes associated with RNA splicing, DNA repair, the inflammatory response, and the immune response were increased in the PM10-treated group compared to the control group. The number of genes with significant change are presented at the top of bar. OVA: ovalbumin; PM: particulate matter.
Discussion
This study confirmed that PM10 can alter immune and inflammatory processes of the lung at the gene, protein, and cellular levels, using a murine model. In a substantial advance on previous work, we showed that exposure to PM10 can extensively alter RNA expression in lung homogenates. PM10 induced increased RNA expression associated with RNA splicing, DNA repair, cell death, apoptotic processes, the inflammatory response, and the immune response. The above processes are associated with the cell cycle, cell viability, and cellular proliferation. Potential consequences of such widely altered RNA expression profiles include necrosis, malignancy, and other diseases. Referring to the results of our RNA expression analysis, we can potentially predict various clinical effects of PM10, and conduct further studies concerning mechanisms underlying these effects.
Inhalation of PM10 induced proliferation of inflammatory cells and fibrosis in peri-bronchial and lung tissue. We speculated that abundant helper T cell type I (Th1) type inflammatory cytokines increased in lung homogenates might lead to these changes. Some previous studies have shown similar results: Th1 type inflammatory cytokines increased in PM10 treated model [24,25]. Other studies also showed PM10 is associated with inflammation [26] or fibrosis [27] of lung. Based on this study and previous in vitro and in vivo studies, PM10 is definitely toxic material to airway and lung parenchyme. Many human studies also support that PM10 has negative effects on lung and airway diseases [28].
It is notable that we observed extremely high expression of Rn45s (8,058-fold change), Snord22 (676-fold change), and Atp6v0c-ps2 (196-fold change) in the PM10 treated group, compared to the control group. Rn45s is known to be associated with RNA toxicity, but its function has not been fully elucidated [29]. Snord22 is small nucleolar RNA. Atp6v0c-ps2 is associated with ATPase, H+ transporting, and lysosomal V0 subunit C. This plays a central role in H(+) transport across cellular membranes [30]. In addition, Snora28, Snord15b, Snora70, Mmp12, Rprl3, BC1, Snora17, AA467197, Snora26, Ccl17, Rpph1, and Clec4d were also highly expressed in the PM10-treated group compared to the control group. These genes are associated with small nucleolar RNA, brain cytoplasmic RNA, or specific chemokines [31,32]. In the OVA/PM10-treated group, the genes Clca1, Snord22, Retnla, Prg2, Tff2, Atp6v0c-ps2, Fcgbp, Muc5ac, Itln1, Ngp (neutrophilic granule protein), Fxyd4 (FXYD domain-containing ion transport regulator 4), Mzb1 (marginal zone B and B1 cell-specific protein 1), Mmp12 (matric metallopeptidase 12), Camp (cathelicidin antimicrobial peptide), and Tff1 were upregulated compared to control group.
Some genes were extremely suppressed in the PM10-treated group, compared to the control group: Chil4, Krt13, Krtdap (keratinocyte differentiation associated protein), Sprr2a3 (small proline-rich protein 2A3), Krt4, Tnnc2 (troponin C2, fast), Acta1 (actin, alpha 1, skeletal muscle), Mt4, Serpinb3c (serine peptidase inhibitor, clade B, member 3C), Lgals7 (lectin, galactose binding, soluble 7), Crct1 (cysteine-rich C-terminal 1), Serpinb12 (serine peptidase inhibitor, clade B, member 12), Tnnt3 (troponin T3, skeletal, fast), Mylpf (myosin light chain, phosphorylatable, fast skeletal muscle), and Lce3a (late cornified envelope 3A). In the OVA/PM10-treated group, the genes Krt6b, serpinb12, Crct1, Mylpf, Lce3b (late cornified envelope 3B), Defb4 (defensin beta 4), Lce3a, Lgals7, Serpinb3c, Mt4, Krt4, Acta1, Tnnc2, Krtdap, and Krt13 were substantially downregulated compared to the control group.
PM10 altered RNA expression in extensive range. It also increased production of inflammatory cytokines. Inflammation and fibrosis were also induced. However, its effects were only slightly greater than those of OVA. We used an acute-OVA model with intraperitoneal OVA sensitization and intranasal OVA challenge. This model also showed extensive changes of RNA expression and abundant inflammation. Because of the magnitude of the changes caused by OVA, additional effects of PM10 were not well revealed. In clinics, severe asthma often leads to hide the clinical effects of other underlying disease, like stable COPD [33]. However, Gold et al.[34] ]showed that PM mediates and augments allergic sensitization and cellular proliferation using a murine model, and Clifford et al. [35] showed that PM10 exposure exacerbates various responses to respiratory viral infection, e.g., increased inflammation and impaired lung function. Then, we are not sure whether addictive or synergic effects of PM10 in mild or chronic asthma model [36]. In order to further clarify whether PM10 has additive or synergic effects on an allergy model, a further-modified OVA model which does not hide the effects of PM10, is needed.
PM10 is a major air pollutant, and thus ends up in the human respiratory system where it can facilitate and aggravate allergic sensitization and airway inflammation [17,37]. This also alters defense mechanisms, including innate immunity in the lungs [38]. Thus, respiratory diseases can be developed and aggravated by exposure to PM10. However, studies elucidating the effects of PM10 using murine models are rare, and changes of RNA expression induced by PM10 have not been well studied. This study used standardized PM10 in a murine model, and showed extensive RNA expression changes. Our results can be used to inform future work using PM10-treated murine models, including further investigation of mechanisms underlying the damaging effects of PM10 on the airway and lung. Finally, this study will be helpful to search for therapeutic agents in PM10-exposured human airway and lung diseases.
We showed that inhalation of PM10 changed RNA expression in extensive range in a murine model. PM10 also induced increased production of inflammatory cytokines, cellular proliferation, and fibrosis. In an acute-OVA model, additional effects of PM10 were not observed. Our findings suggest PM10 can affect various airway and lung diseases.
Notes
Authors’ Contributions
Conceptualization: Park HJ. Methodology: Han H, Oh EY. Formal analysis: Park HJ, Lee JH, Park JW. Data curation: Park HJ, Lee JH, Park JW. Software: Park HJ, Lee JH, Park JW. Validation: Han H, Oh EY, Park HJ, Lee JH, Park JW. Investigation: Han H, Oh EY, Park HJ, Lee JH, Park JW. Writing - original draft preparation: Park HJ. Writing - review and editing: Park HJ. Approval of final manuscript: all authors.
Conflicts of Interest
No potential conflict of interest relevant to this article was reported.
Funding
This study was supported by a 2019-grant from The Korean Academy of Tuberculosis and Respiratory Diseases.
Supplementary Material
Supplementary material can be found in the journal homepage (http://www.e-trd.org).
Animal model design protocol. IN: intranasal treatment; IP: intraperitoneal treatment; OVA: ovalbumin; PM: particulate matter.
Fast QC data in control (A), PM10-treated (B), and OVA/PM10-treated group (C). OVA: ovalbumin; PM: particulate matter.

