Relation of Pulmonary Function Impairment and Coronary Artery Calcification by Multi-detector Computed Tomography in Group Exposed to Inorganic Dusts
Article information
Abstract
Background
The purpose of this study was to evaluate the relationship of pulmonary function impairment (PFI) and coronary artery calcification (CAC) by multi-detector computed tomography (MDCT), and the effect of pneumoconiosis on CAC or PFI.
Methods
Seventy-six subjects exposed to inorganic dusts underwent coronary artery calcium scoring by MDCT, spirometry, laboratory tests, and a standardized questionnaire. CAC was quantified using a commercial software (Rapidia ver. 2.8), and all the subjects were divided into two categories according to total calcium scores (TCSs), either the non-calcified (<1) or the calcified (≥1) group. Obstructive pulmonary function impairment (OPFI) was defined as forced expiratory volume in one second/forced vital capacity (FEV1/FVC, %)<70, and as FEV1/FVC (%)≥70 and FVC<80 for restrictive pulmonary function impairment (RPFI) by spirometry. All subjects were classified as either the case (profusion≥1/0) or the control (profusion≤0/1) group by pneumoconiosis findings on simple digital radiograph.
Results
Of the 76 subjects, 35 subjects (46.1%) had a CAC. Age and hypertension were different significantly between the non-calcified and the calcified group (p<0.05). Subjects with pneumoconiosis were more frequent in the calcified group than those in the non-calcified group (p=0.099). FEV1/FVC (%) was significantly correlated with TCSs (r=-0.316, p=0.005). Subjects with OPFI tended to increase significantly with increasing of TCS (4.82, p=0.028), but not significantly in RPFI (2.18, p=0.140). Subjects with OPFI were significantly increased in the case group compared to those in the control group.
Conclusion
CAC is significantly correlated with OPFI, and CAC and OPFI may be affected by pneumoconiosis findings.
Introduction
The presence and extent of coronary artery calcification (CAC) has been shown to correlate with the degree of atherosclerosis1. Since the quantification of CAC by ultrafast computed tomography has been reported for the first time by Agatston et al.2, several studies showed that calcium scoring of multi-detector computed tomography (MDCT calcium scoring) is a very useful screening method to detect atherosclerosis in the early stage3 and CAC is could be considered as an independent predictor of atherosclerosis4-6.
Occupational exposure to dusts, toxic particles, and gas could induce pulmonary function impairment (PFI)7 and increase the risk of death by cardiovascular diseases including atherosclerosis8-10. In addition, the prevalence of CAC was higher than that of other findings on low dose chest CT images to screen lung diseases in the group exposed to dusts in Korea11.
Although PFI was significantly associated with ischemic heart diseases12,13, the relationship of PFI and CAC quantified by MDCT has not yet been fully clarified14,15. Also, to the best of our knowledge, the relationship between PFI and CAC measured by MDCT has not been studied in the group exposed to dusts.
Therefore, the purpose of this study was to evaluate the relationship of PFI and CAC quantified by MDCT, and the effect of pneumoconiosis on CAC or PFI.
Materials and Methods
1. Subjects
From April 5, 2010 to July 9, 2010, MDCT calcium scoring was performed on 115 subjects who exposed to inorganic dusts. Then, these subjects were matched with spirometry, laboratory, and questionnaire data collected during same period in the cohort of occupational dust exposure worker. All examinations were performed after being approved by the Institutional Review Board, and obtained the informed consent from all subjects. Of 115 subjects with MDCT calcium scoring, only 79 subjects were analyzed for this study except 39 subjects who had history of cardiovascular disease, such as myocardial infarction, stroke, and cerebral hemorrhage, or who didn't match with cohort of occupational dust exposure worker, or who had large opacity on digital chest imaging.
2. Risk assessment of cardiovascular diseases
1) Questionnaire and physical measurements
Researchers had interviews directly with the subjects using structured questionnaire to obtain general characteristics of the subjects and the risk factors of cardiovascular diseases that were already known (age, smoking history, duration of inorganic dust exposure, heart diseases, diabetes, hypertension, stroke, etc.). Body mass index (kg/m2) was calculated from height and weight that were measured without wearing shoes. Hypertension was defined when the systolic and diastolic blood pressure measured by trained nurses (rest for more than 10 minutes prior to measurement and then measure in a sitting position) was more than 140 mm Hg and 90 mm Hg, respectively, or when administering antihypertensive drugs. All the subjects were classified into either the control group or the case group (small opacity profusion ≥ 1/0) by consensus reading of two chest radiologists for pneumoconiosis based upon digital chest imaging (produced by Digital Diagnost, Philips, Netherlands).
2) MDCT calcium scoring
MDCT calcium scoring was performed based on the protocol generally applied in clinical practice (ECG-gated, 55 mAs, 120 kVp, 3-mm thickness, 8×3 mm acquisition) without use of contrast medium using a 16-slice MDCT (Brilliance 16 slice; Philips, Netherlands). Row images scanned were transferred to a special workstation, and then CAC was quantified at each coronary artery using commercial software (Rapidia version 2.8; Infinitt Healthcare, Seoul, Korea). CAC was defined as the area with more than 130 hounsfield units of attenuation coefficient according to the Agatston's method2. All subjects were classified into either the non-calcified group (total calcium score [TCS]<1) or the calcified group (TCS≥1) from TCSs of coronary artery (TCSs)6, TCSs were further categorized into three score ranks: <1, 1-400, >400, as risk stratifications for coronary artery disease.
3) Analysis of cardiovascular risk factor in serum
Blood collection was conducted after fasting for 8 hours. Serum was seperated within 1 hour and stored at -80℃ until analysis. Serum concentrations of total cholesterol, low density lipoprotein (LDL)-cholesterol, high density lipoprotein (HDL)-cholesterol, creatinine, and C-reactive protein (CRP) were determined by automatic immunochemistry analyzer (Hitachi 7080; Hitachi, Tokyo, Japan).
4) Spirometry
Spirometry were performed according to the American Thoracic Society (ATS) and Europe Respiratory Society (ERS) guidelines16 using a spirometer (Vmax-229; Viasys Healthcare, Yorba Linda, CA, USA). Prior to spirometry, the spiromete was calibrated to be ranged between 2.91 and 3.09 L in air volume that was measured both gradually for 6 seconds and quickly for 0.5-1 seconds using 3 L-syringe. Past and current medical history and health condition of the subjects were confirmed and then closed circulatory method was carried out in a sitting position on a chair with straightened upper body, slightly raised chin, and slight hold the neck back with nose clip on. Spirometry was carried out 8-10 minutes later, after inhalation 4 times sequentially (400µg) the bronchodialator containing salbutamol (ventolin). The suitable test was performed more than 3 times and then the best values were selected among the values that the forced vital capacity (FVC % predicted value) and forced expiratory volume in one second (FEV1 % predicted value) of each test were within 5% (150 mL) each other (best value method). FVC and FEV1 were measured based on sex, height, and weight of subjects applying Moris equation and then expressed as the ratio of actual values regarding predicted values, then the ratio of FEV1 on the FVC (FEV1/FVC % predicted value) was calculated. Obstructive pulmonary function impairment (OPFI) was defined as FEV1/FVC (%)<70, and as FEV1/FVC (%)≥70 and FVC<80 for restrictive pulmonary function impairment (RPFI). The OPFI was classified into three categories according to severity as a results of spirometry: normal=FEV1/FVC≥70%; mild=OPFI & FEV1≥80%; moderate=OPFI & 50%≤FEV1<80%7.
3. Statistical analysis
Statistical analysis was performed by chi-square test for categorical variables and Student's t-test for continuous variables using SPSS version 19.0 (SPSS Inc., Chicago, IL, USA). Relation of RPFI or OPFI with grading of TCSs was performed by linear by linear association of chi-square test. Relationship of TCSs and FEV1/FVC (%) was calculated by Pearson correlation analysis. p-values less than 0.05 were considered statistically significant.
Results
1. Comparison of general characteristic and risk factors between non-calcified and calcified groups
Mean age and dust exposure duration of the subjects were 61.7±8.4 years old (range, 45.0-81.9 years) and 18.8 years (range, 4.5-44.0 years), respectively. Mean body mass index of the subjects were 23.9±3.2 kg/m2 (range, 15.4-30.5 kg/m2), and smokers including former smokers were 90.8%.
Total 35 (46.1%) of 76 subjects had a CAC (Table 1). Age, hypertension, and TCSs were statistically significant differences between the non-calcified and the calcified groups (p<0.05), and pneumoconiosis, LDL-cholesterol, FEV1/FVC (%), and OPFI showed marginally significant differences between the two groups. Additionally, smokers, systolic and diastolic blood pressure, total cholesterol, HDL-cholesterol, CRP, creatinine, and RPFI were higher in the calcified group compared to the non-calcified group, but indicating that the differences were not statistically significant. Subjects with normal pulmonary functions in the non-calcified group were more than those in the calcified group (p=0.357).
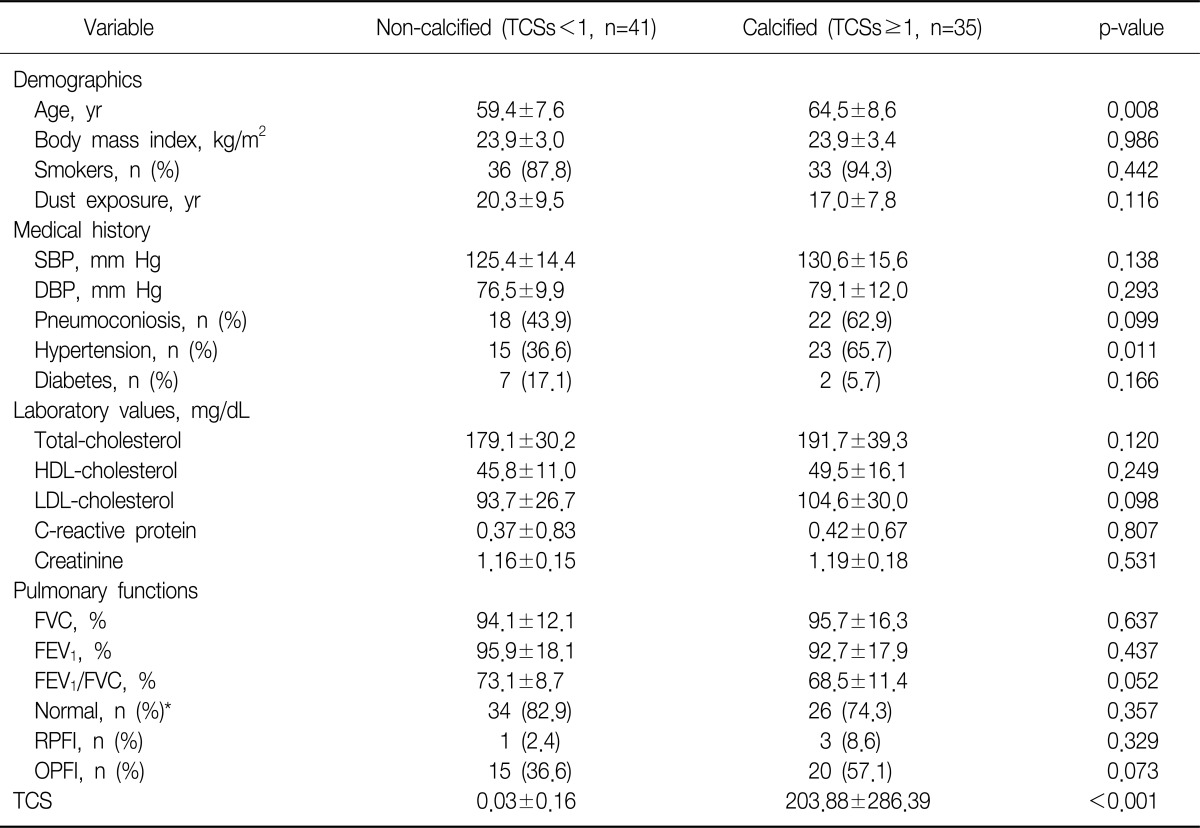
Comparison of general characteristics and risk factors between the non-calcified and calcified group at the coronary artery
2. Relationship of pulmonary functions and TCSs
As shown in Figure 1, TCSs significantly decreased as the FEV1/FVC (%) increased (r=-0.316, p=0.005). However, TCSs or FEV1/FVC (%) was not significantly correlated with CRP (data is not presented).

Scatterplot shows that relationship of forced expiratory volume in one second/forced vital capacity (FEV1/FVC, %) and total calcium score. FEV1/FVC (%) was significantly correlated with total calcium score. Pearson's correlation coefficient was -0.316 (p=0.005).
Figure 2 illustrates the frequency of subjects with RPFI or OPFI according to the 3 categories of TCSs. The frequency of subjects with OPFI tended to increase significantly with the increase of categories of TCSs (4.82, p=0.028), but not significant in RPFI (2.18, p=0.140).
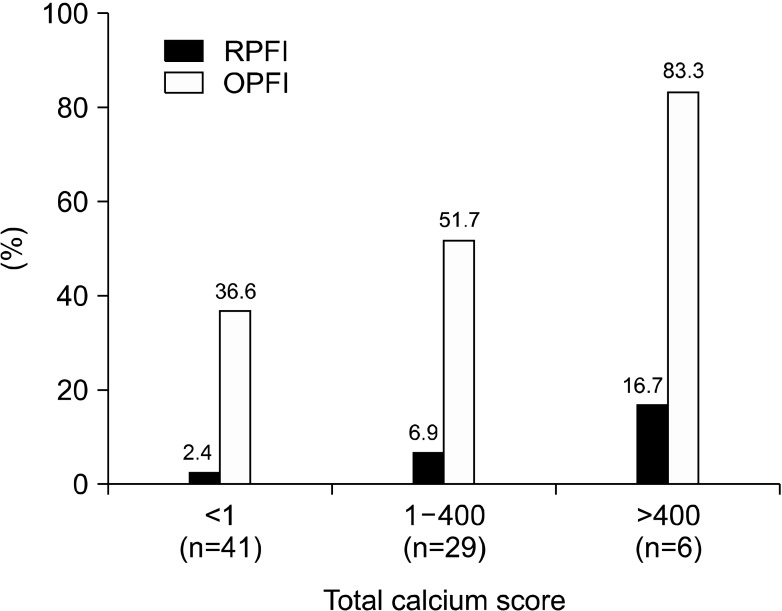
Percentage of subjects with obstructive pulmonary function impairment (OPFI) tended to increase significantly according to the increase of categories of total calcium score (4.82, p=0.028), but not significant in restrictive pulmonary function impairment (RPFI; 2.18, p=0.140), by calculating the linear by linear association of chi-square test. RPFI was defined as forced expiratory volume in one second/forced vital capacity (FEV1/FVC, %) ≥70 and FVC<80, and as FEV1/FVC (%)<70 for OPFI by spirometry.
3. Pulmonary functions according to pneumoconiosis findings
Table 2 shows the pulmonary functions comparing between the control and the case groups for pneumoconiosis. FEV1/FVC (%) of the control group was significantly higher compared to the case group (p=0.003), and also FEV1 (%) was higher in the control group than in the case group (p=0.124). The frequency of subjects with OPFI was significantly higher in the case group than in the control group (65.0% vs. 25.0%, p<0.001). The frequency of the case group was significantly increased, as OPFI was severe (p=0.002).
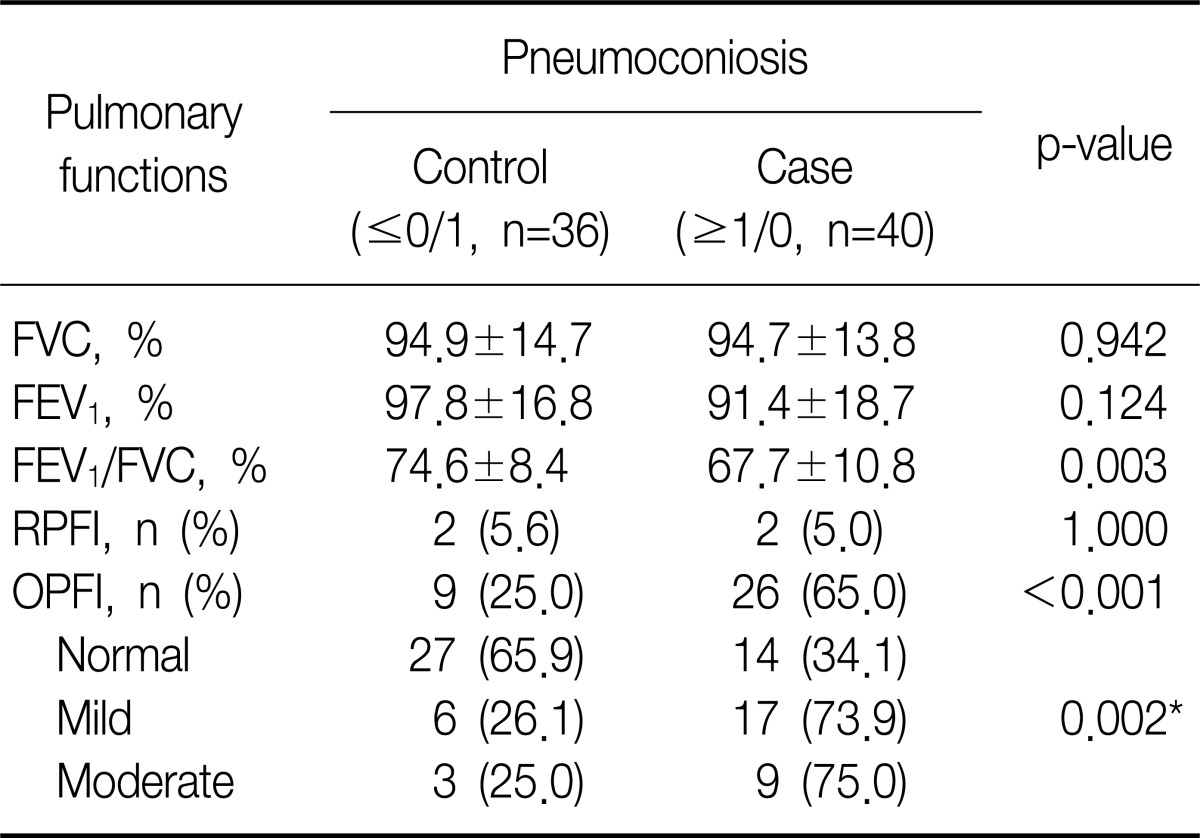
Comparison of pulmonary functions between the control and case group for pneumoconiosis
Discussion
The atherosclerosis is independently predicted by CAC of MDCT which is closely associated with PFI15. To our knowledge, the current study is the first in evaluating the relationship of MDCT calcium scoring and PFI in group exposed to inorganic dusts. In this study CAC showed in 46.1% of subjects, this may be because they had many risk factors of atherosclerosis, such as old age and dust exposed group. Age and hypertension known as risk factors from previous studies were significantly higher in the calcified group compared to the non-calcified group, and FEV1/FVC (%) and OPFI were higher in the calcified group.
We found new findings that the subjects with pneumoconiosis showed high frequency in the calcified group than in non-calcified group, but our study had not sufficient sample size to clarify whether the pneumoconiosis is the risk of CAC. Therefore, the future needs the prospective study with large sample size and test power.
FEV1 (%) and FEV1/FVC (%) are utilized as indicators of PFI, which can be classified into RPFI (related to interstitial lung diseases) and OPFI (related to chronic bronchitis, pulmonary emphysema, and asthma), and inflammation is relevant to OPFI7. In the present study, TCSs was significantly decreased as FEV1/FVC (%) was increased, which was in agreement with a study by Park et al.15. Additionally, in this study, the frequency of subjects with RPFI or OPFI tended to increase as the category of TCSs was increased, indicating that CAC is relevant to PFI. Particularly, it was significantly related to the OPFI induced by inflammation rather than the RPFI induced by interstitial lung diseases. In a study with large number of people who received physical check-ups15, CAC was also an independent predictor of RPFI as well as OPFI, especially more closely associated with OPFI.
CRP can be used as a predictor of atherosclerosis that increase of CRP is related to develop atherosclerosis or inflammation4,6,17. However, predicting of CAC by CRP is not significantly meaningful because of the weak correlation between CRP and CAC4. In the present study, CRP was significantly higher in the calcified group than in the non-calcified group, but it was not significantly correlated with CAC. Also, it is known that CRP as well as the risk of atherosclerosis are increased in the OPFI group caused by chronic inflammation13. In this study, CRP was higher in both RPFI and OPFI groups than in the normal pulmonary function group, but CRP was not significant difference between RPFI and OPFI groups (0.45 vs. 0.46).
In the study regarding the effects of OPFI on atherosclerosis14, the OPFI group showed significantly higher number of blood vessels with atherosclerosis (2.5 vs. 2.1, p=0.004), the frequency of obstructed vessels (59% vs. 31%, p=0.005), and calcification frequency (29% vs. 2.8%, p=0.004) than that of the normal group. Moreover, FEV1/FVC (%) and FEV1 (%) were significantly negatively correlated with atherosclerosis extent, and atherosclerosis was more intense as the level of OPFI was increased.
Exposure to inorganic dusts in the work could cause chronic OPFI7,18. In a recent study with subjects who exposed to inorganic dusts in Korea19, FEV1 was significantly reduced as the subjects were older, and annual pulmonary function tended to decrease more in the pneumoconiosis group compared to that of the normal group. In another study20 the pulmonary function was significantly lower in the pneumoconiosis group than that of the normal group. In the present study, FEV1/FVC (%) was reduced significantly with age of subjects (r=-0.35, p=0.002) and FEV1/FVC (%) was significantly lower in the case group than that of the control group for pneumoconiosis. The frequency of RPFI was not significance different between the case and the control groups, but the frequency of OPFI was significantly high in the case group indicating that pneumoconiosis findings are more closely associated with OPFI. Likewise, it has been suggested that chronic inflammation and oxidative stress due to inhalation of inorganic dusts can induce PFI, and have relation with development of atherosclerosis21, but the mechanism has not been clearly understood yet.
The limitations of this study were as following. First, even through some variables (smoking, systolic and diastolic blood pressure, pneumoconiosis, laboratory, and spirometry) were differences between the calcified and the non-calcified group, significant outcomes could not obtain because of small number of subjects. If prospective studies are performed in large number of subjects with statistical power of tests in the future, more meaningful results would be obtained. Second, the authors didn't consider the fact that the pulmonary emphysema findings diagnosed on digital chest imaging would increase the risk of OPFI22. However, the interpretation of the results in this study would be reasonable because this study was focused on the relationship between CAC and PFI.
Given the results, the present study can be summarized as follows. First, FEV1/FVC (%) was significantly reduced and TCSs was significantly increased with age. Second, TCSs were significantly negative correlation with FEV1/FVC (%), and frequency of subjects with OPFI tended to increase significantly with the increase of categories of TCSs. Third, the frequency of the subjects with pneumoconiosis in the calcified group was higher than that in the non-calcified group, and frequency of subjects with OPFI was significantly higher in the case group than in the control group for pneumoconiosis.
In conclusion, CAC is significantly correlated with OPFI, and CAC and OPFI may be affected by pneumoconiosis findings.