A Rapid Assessing Method of Drug Susceptibility Using Flow Cytometry for Mycobacterium tuberculosis Isolates Resistant to Isoniazid, Rifampin, and Ethambutol
Article information

Abstract
Background
The current conventional drug susceptibility test (DST) for Mycobacterium tuberculosis (Mtb) takes several weeks of incubation to obtain results. As a rapid method, molecular DST requires only a few days to get the results but does not fully cover the phenotypic resistance. A new rapid method based on the ability of viable Mtb bacilli to hydrolyze fluorescein diacetate to free fluorescein with detection of fluorescent mycobacteria by flow cytometric analysis, was recently developed.
Methods
To evaluate this cytometric method, we tested 39 clinical isolates which were susceptible or resistant to isoniazid (INH) or rifampin (RIF), or ethambutol (EMB) by phenotypic or molecular DST methods and compared the results.
Results
The susceptibility was determined by measuring the viability rate of Mtb and all the isolates which were tested with INH, RIF, and EMB showed susceptibility results concordant with those by the phenotypic solid and liquid media methods. The isolates having no mutations in the molecular DST but resistance in the conventional phenotypic DST were also resistant in this cytometric method. These results suggest that the flow cytometric DST method is faster than conventional agar phenotypic DST and may complement the results of molecular DST.
Conclusion
In conclusion, the cytometric method could provide quick and more accurate information that would help clinicians to choose more effective drugs.
Introduction
Tuberculosis (TB) remains a leading cause of death from infectious diseases with an estimated 10 million new TB cases and 1.2 million deaths in 2018 [1]. Drug susceptibility test (DST) for Mycobacterium tuberculosis (Mtb) is critical for the treatment and the control of TB. The process of the test involves the primary culture of clinical TB specimens to isolate Mtb and DST assay. Conventional DST is a solid culture-based method that uses egg-based or agar-based media. This is the reference method for phenotypic DST (pDST). However, this method requires a long turnaround time for Mtb culture, so it takes 2–3 months to confirm the DST results [2,3].
In order to shorten the turnaround time, rapid liquid culture-based techniques with automation systems have been developed and DST results could be obtained within a month because Mtb relatively grows faster in liquid media than solid media. The most commonly used systems are BACTEC 460 (Becton Dickinson, Sparks, MD, USA) which detects carbon dioxide production, and Mycobacteria Growth Indicator Tube (MGIT; Becton Dickinson) which detects oxygen consumption [3-6].
More rapid tests, molecular DST (mDST) methods, have been developed and used widely to detect drug resistance by identifying genetic mutations associated with specific drugs. These tests include line probe assay and GeneXpert and with these assays, it takes only a few days to get the results [3,6-8]. However, although 95% of rifampicin (RIF) resistance-associated mutations are present in the rpoB gene, not all resistance-related genes for the different antituberculosis drugs and their sites of the mutation have been found [6,9,10]. Therefore, opposite results between pDST and mDST could be obtained sometimes and such incomplete information of susceptibility might increase the risk of treatment failure and development of resistance to additional drugs.
A new rapid method based on the ability of viable Mtb bacilli to hydrolyze fluorescein diacetate (FDA) to free fluorescein with detection of fluorescent Mtb by flow cytometric analysis, has already been developed by a couple of research groups [11,12]. The accumulated fluorescein in viable cells can be easily detected by flow cytometric analysis and the susceptibility results are obtained only in 24 hours [13-16]. However, their results do not provide the Mtb growth and the viability information during the incubation period with anti-TB drugs [17]. Therefore, we have extended this cytometric method to measure the viability rate during the incubation of Mtb with anti-TB drugs. In this study, in order to assess the susceptibilities of isoniazid (INH), RIF, and ethambutol (EMB), we tested 39 clinical isolates and compared the results with those of the standard phenotypic and molecular methods. We demonstrated that the cytometric method would be faster than the standard pDST method and provide drug-tolerance information per time. This new method could be used as an alternative DST testing and provide useful information to the clinician.
Materials and Methods
1. Bacterial strains and culture conditions
The strain H37Rv and hypervirulent clinical HN878 strain were provided by Dr. R. Cho (Yonsei University, Seoul, Korea) and used as reference strains. The Mtb clinical isolates were originally isolated from the sputum of TB patients at the National Masan Tuberculosis Hospital (NMTH). Human tissue collection was approved by the Institutional Review Board of NMTH (IRB-05-I-N69) and written informed consent was obtained from the patients. The isolates were cultured in Middlebrook 7H9 broth supplemented with 0.5% glycerol, 0.05% Tween 80, and 10% OADC.
2. Antimycobacterial agents
INH, RIF, and EMB were purchased from Sigma (St. Louis, MO, USA). Stock solutions of INH and EMB were prepared at 5 mg/mL in distilled water and sterilized by filtration with a 0.2-mm-pore-size filter before being dispensed in 1.0-mL aliquots and stored at –80°C until used. RIF (5 mg/mL) was prepared similarly in methanol.
3. pDST and mDST for drug resistance
Two pDST methods were employed. First, Mtb isolates were processed on Löwenstein-Jensen (L-J) plates containing anti-TB drugs using an absolute concentration method [2,3]. The critical concentrations of each test drug for resistance were 0.2 µg/mL of INH, 40 µg/mL of RIF, and 2 µg/mL of EMB. Drug resistance was defined when more than 1% of colony isolate grew on a drug-containing medium after 4 weeks of incubation at 37°C. As another pDST method, MGIT 960 system was used with the grown isolates on L-J culture [3]. The drug concentrations were 0.1 µg/mL of INH, 1 µg/mL of RIF, and 2 µg/mL of EMB.
Molecular genetic identification of the isolates was also performed using two assay commercial kits from Hain Lifescience GmbH (Nehren, Germany), Genotype MTBDRplus for the mutations detection of rpoB (RIF), katG, and inhA (INH) genes and Genotype MTBDRsl for embB (EMB) gene according to manufacturer’s instructions.
4. Assessment of drug susceptibility by flow cytometry
A DST was performed using a flow cytometer (Cytomic FC500, Beckman Coulter, Miami, FL, USA) that has lasers with excitatory wavelengths of 488 nm (Arogon-ion Laser). FDA fluorescence emission (ex/em 488 nm/530 nm) was detected in channel FL1 [520-550 Band Pass]. Un-stained control samples were analyzed to set a population gate around the Mtb to be analyzed by using the forward scatter versus side scatter parameters. The voltages were adjusted in channels FL1 (FDA) so that the fluorescence histogram of the un-stained Mtb appeared within the first order of the logarithmic scale of fluorescence. The remaining stained samples were analyzed at the settings. The 20,000 events were collected at a set standard ‘Low’ event rate.
The Mtb isolates were grown in the above culture media and transferred to a 50 mL conical tube and adjusted to 0.01 of optical density with a final volume of 4 mL 7H9 media. The tubes were added with 0.1 mL of INH at 0.1 µg/mL, RIF at 1 µg/mL, or EMB at 2 µg/mL and incubated at 37°C shaking incubator. These drug concentrations were the same as those used in the MGIT liquid culture DST method. At the time points of 0, 3, 7, 10 days post-infection, 0.5 mL of the incubated isolates were transferred to an Eppendorf tube and treated with FDA at 50 µg/mL. After incubation at 37°C for 30 minutes, the isolates were harvested and washed twice with distilled water by centrifuging at 12,000 rpm for 10 minutes. The supernatant was discarded, and 4% paraformaldehyde was added at 500 µL/tube.
The acquired data were analyzed to create a one-parameter fluorescence histogram plot. The x-axis (FL1 log) is a plot indicating the intensity of fluorescence stained by Mtb and the y-axis (count) is a plot indicating the number (Figure 1). Using un-stained Mtb bacilli as a control, regions were determined, and samples were analyzed. The percentages indicated on the histogram mean live bacteria.
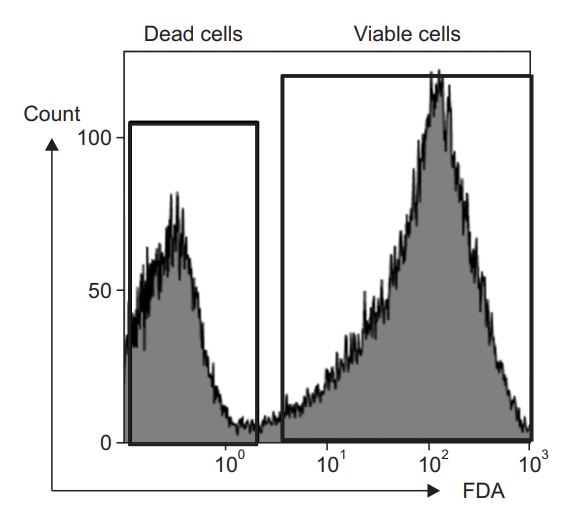
Intensity of fluorescence showing the counts for dead and viable Mycobacterium tuberculosis cells. Killed M. tuberculosis by boiling was used for the positive control range of dead cells. The cultured H37Rv cells were stained with fluorescein diacetate (FDA) and analyzed with flow cytometry. The % of viable cells was measured.
5. Statistical analysis
Statistical analysis using a t-test was performed to determine differences in viability rate of Mtb isolates between the drug-untreated and drug-treated groups. Results
Results
1. Assessment of drug susceptibility of Mtb using flow cytometry
The cultured Mtb cells stained with FDA were assessed with flow cytometry and the % of viable cells was measured as shown in Figure 1. Heat-killed Mtb bacilli were used for the positive control of dead cells. With this method using flow cytometry, the Mtb-killing rate of INH could be measured in H37Rv and an extensive drug-resistant (XDR) strain (Figure 2). During the incubation of H37Rv without INH, the viability rate was more than 95% for 10 days and similar results were observed in the XDR strain. Co-incubation of H37Rv with INH suppressed the % of viability to less than 10% at day 3 post-incubation and lasted until day 10. As expected, XDR strain with INH showed no reduction of viability and similar levels to the no-INH group for 10 days (Figure 2).
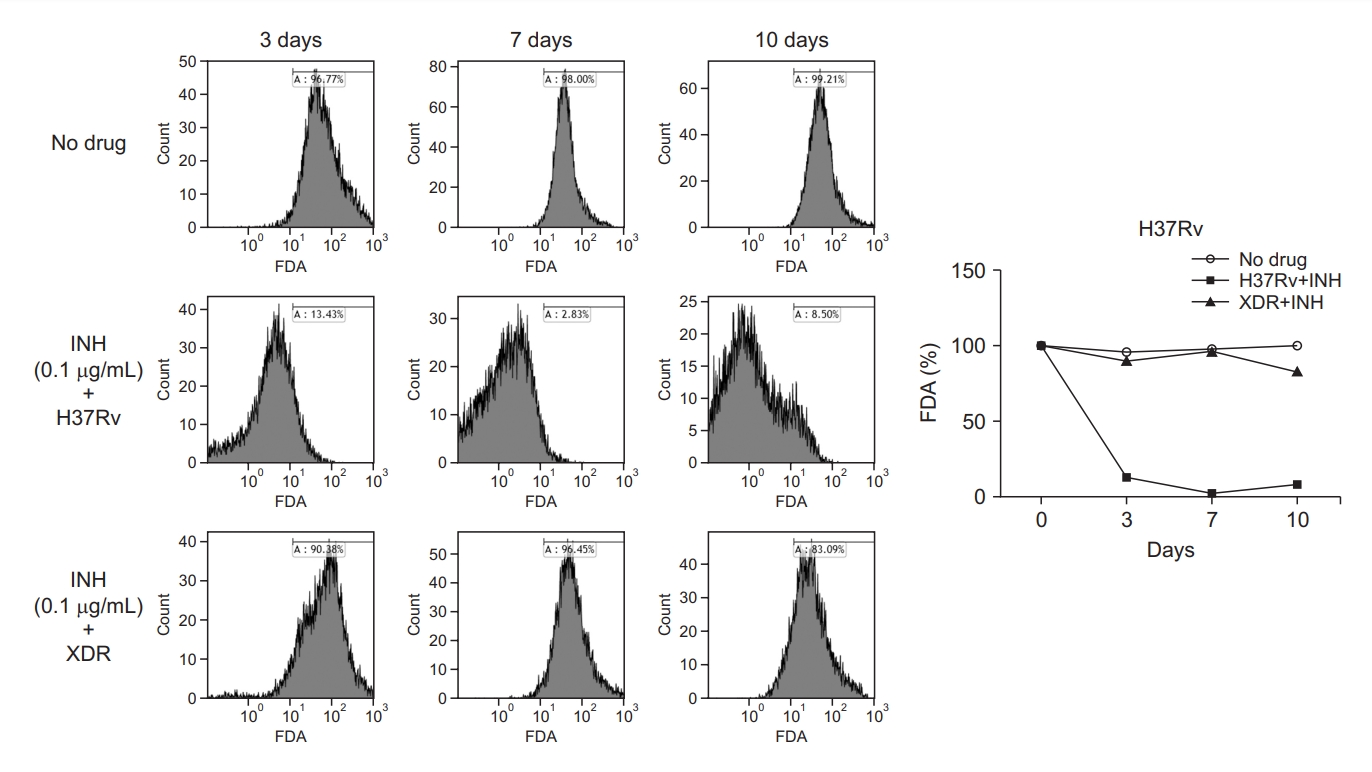
Effect of isoniazid (INH) on the % viability of H37Rv and an extensive drug-resistant (XDR) strain. Mycobacterium tuberculosis strains were incubated with or without INH at 0.1 µg/mL for 10 days before treatment with fluorescein diacetate (FDA). The % viability was measured at the time points of 3, 7, and 10 days by flow cytometry and represented as a histogram and a line graph.
The lab standard H37Rv and the clinical standard HN878 strains’ response to INH, RIF, and EMB were tested and the susceptibility pattern of each drug was examined to determine the cutoff value of the susceptibility. Co-incubation of these two strains with INH and EMB suppressed the viability rate to less than 10% at day 3 and lasted until day 10. In contrast, RIF induced different patterns of killing H37Rv and HN878. The viability rate of both strains reduced slowly after incubation with RIF and at day 10 the % of viability was about 20% and about 40% in H37Rv and HN878, respectively (Figure 3). The group with no drug showed no reduction of viability for 10 days in both strains. Since the strains to be tested in this study were Mtb clinical isolates, the cutoff value of the susceptibility was set as 10% for INH and EMB and 40% for RIF, which were chosen for the clinical drug-sensitive standard strain of HN878 (Figure 3).
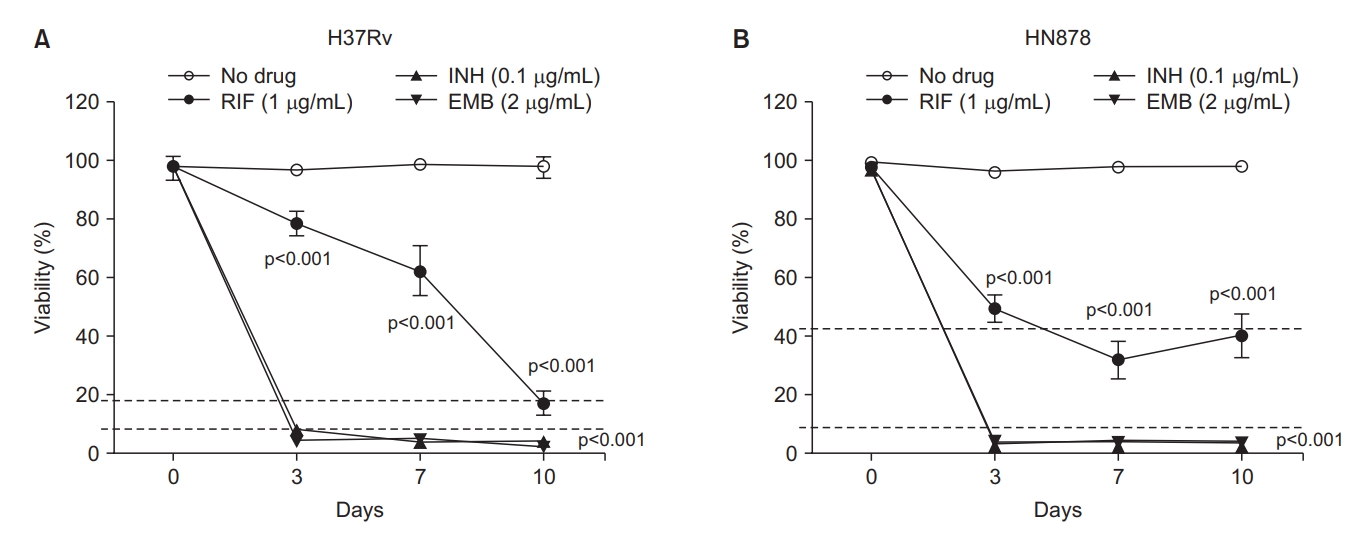
The pattern of the % viability of H37Rv (A) and HN878 (B) strains to isoniazid (INH), rifampin (RIF), and ethambutol (EMB). The cutoff value for the susceptibility of each drug was determined as 10% for INH, and EMB and 40% for RIF. The Mycobacterium tuberculosis strains were incubated with or without INH at 0.1 µg/mL, RIF at 1 µg/mL, and EMB at 2 µg/mL for 10 days before treatment with fluorescein diacetate. The % viability was analyzed and measured by flow cytometry at the time points of 3-, 7-, and 10-days post-incubation and represented as line graphs. The experiments were repeated 3 times and the results are expressed as means±standard error of mean. Unpaired student’s t-tests were used to determine the significance between drug-treated with no drug-treated groups. A p-value <0.05 was considered significant.
2. Testing drug susceptibility of clinical Mtb isolates using flow cytometry
Thirty-nine clinical Mtb isolates susceptible to INH, RIF, and EMB by mDST testing were collected. Phenotypically, however, some of these isolates were drug-resistant (Tables 1–3). These isolates were tested for susceptibility by flow cytometry method and the obtained results were compared with those of pDST and mDST. Figure 4 shows the susceptibility results of the tested isolates to INH, RIF, and EMB by cytometry. All isolates that were phenotypically drug-resistant to INH, RIF, and EMB showed no reduction of % viability for 10 days, indicating they are also drug-resistant by cytometric method (Figure 4). Significant and suppressive reduction of the % viability was observed in phenotypically drug-susceptible isolates in response to INH and EMB and the results were under a cutoff value of 10%. In contrast, the five isolates susceptible to RIF showed a slow reduction of the Mtb viability measured by cytometry but eventually at day 10 after co-incubation with the drug, the % viability fell to the cutoff value of 40% (Figure 4). Two of these five isolates showed a little more than 40% viability but were considered susceptible because they induced a significant reduction of Mtb viability compared to the resistant group (Table 2). At day 14 post-incubation, these two isolates showed less than 40% viability (data not shown).
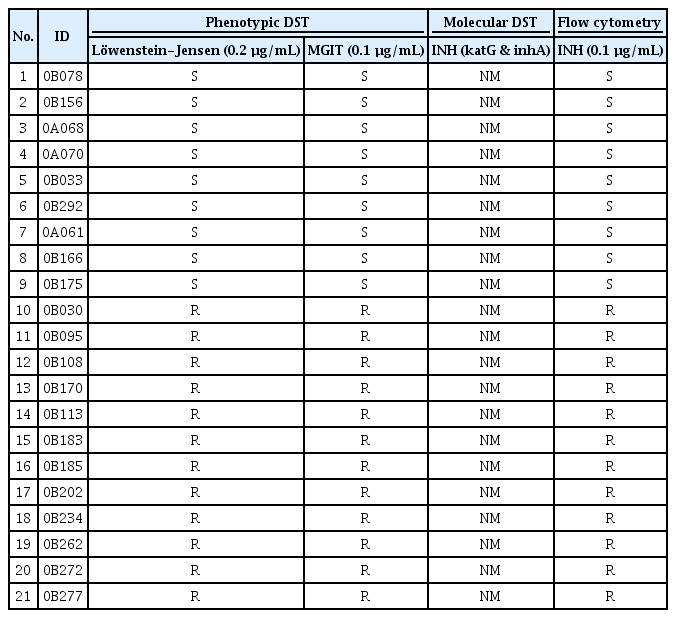
Comparison of the susceptibility test results in response to INH for phenotypically 9 susceptible and 12 resistant clinical isolates of Mycobacterium tuberculosis
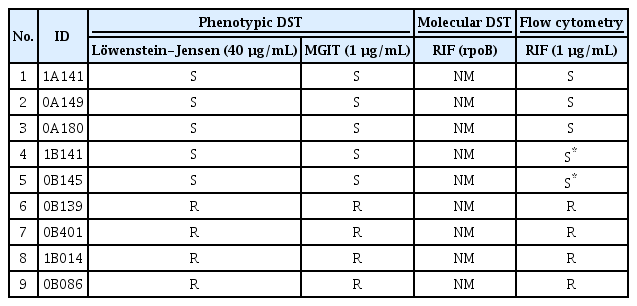
Comparison of the susceptibility test results in response to RIF for phenotypically 5 susceptible and 4 resistant clinical isolates of Mycobacterium tuberculosis
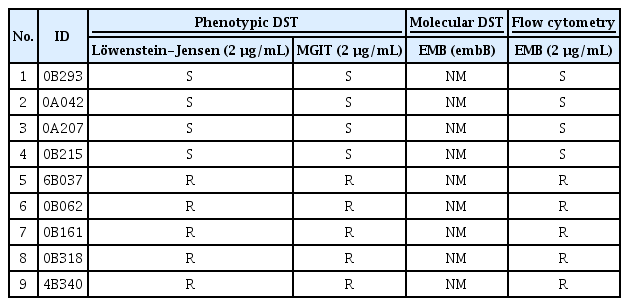
Comparison of the susceptibility test results in response to EMB for phenotypically 4 susceptible and 5 resistant clinical isolates of Mycobacterium tuberculosis
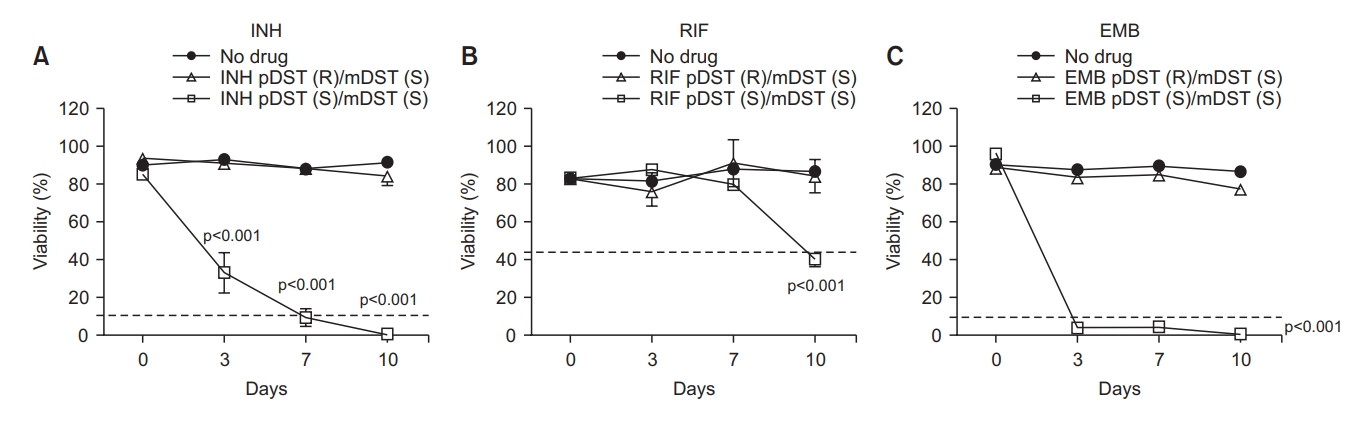
The susceptibility test results of the 39 clinical Mycobacterium tuberculosis isolates by flow cytometry. All the isolates were drug-susceptible (S) in molecular drug susceptibility test (mDST) but some were drug-susceptible or drug-resistant (R) in phenotypic drug susceptibility test (pDST). The isolates were incubated with or without isoniazid (INH) at 0.1 µg/mL (A) or rifampin (RIF) at 1 µg/mL (B) or ethambutol (EMB) at 2 µg/mL (C) for 10 days before treatment with FDA. The % viability was measured at 3-, 7-, and 10-days post-incubation. The experiments were repeated 3 times and the results are expressed as means±standard error of mean. Unpaired student’s t-tests were used to determine the significance between drug-treated with no drug-treated groups. A p-value <0.05 was considered significant.
Discussion
Since the phenotypic methods usually take 3–4 weeks to get the results, the clinicians had to wait to select the exact regimen of drugs. As a rapid method, mDST which requires only a few days to get the results is now widely used. Although molecular testing is faster than the standard pDST methods, it does not fully cover the phenotypic resistance [4,5]. Consequently, the DST information could be inaccurate and might increase the risk of treatment failure and develop drug resistance.
Another rapid method using flow cytometry for testing the drug susceptibility has already developed elsewhere [7,8]. This method is based on the ability of the viable Mtb bacilli to hydrolyze FDA to free fluorescein with detection of fluorescent mycobacteria by flow cytometric analysis and the susceptibility results are obtained within 24 hours of drug co-incubation. Kirk et al. [13] tested the susceptibility of 35 clinical Mtb isolates to INH, RIF, and EMB using flow cytometry and they have shown the results agreement of 83%–95% with those of the agar proportion method. However, they have also found 11 discrepant results to these drugs and the authors have attributed this to the low level of the metabolic activity of the isolates because the hydrolysis of FDA is affected by the metabolic level of Mtb cells. This method did not require the multiplication of mycobacteria and the majority of Mtb cells were not in the exponential growth phase. However, their measurements do not provide the information about the growth and the viability of the Mtb population to drug exposure in medium and a single FDA staining approach has limitations in differentiating between viable bacteria with low metabolic activity and bacteria that are dead. Therefore, in the present study, we have extended this method to measure the % viability of Mtb cells during 10 days of co-incubation with anti-TB drugs, which also provides the information of each drug tolerance per time. We have used only one concentration, which is the critical concentration of each drug in the conventional pDST testing.
Since mDST cannot fully cover the phenotypic resistance, molecular drug-susceptible isolates might be drug-resistant phenotypically. Although the gene involved in RIF resistance, rpoB, occupies 95% of the mutation frequency [4,5], the clinical isolate having no rpoB -mutation but showing resistance phenotypically would appear as shown in this study. The INH- and EMB resistance genes are katG/inhA and embB, and the mutation frequencies are 8%–95% and 47%–65%, respectively [4,5]. Therefore, with such inaccurate information, the clinicians could prescribe the wrong drug regimen to the patients. In the present study, we have evaluated the cytometry test as an additional rapid pDST method. For this purpose, we selected the clinical isolates showing discrepant DST results to the first-line drugs between phenotypic and molecular tests. The susceptibility results by cytometry in response to INH, EMB, and RIF completely agreed with those by the standard phenotypic solid and liquid media DST methods although two RIF-susceptible isolates showed a little higher level than the cutoff value. In our results, all the tested isolates which were phenotypically drug-resistant but had no mutations in mDST testing also showed the resistance in the cytometry test. In addition, our method provides the Mtb viability information by drug per time so we could compare the level of drug tolerance in each isolate of the TB patients. The information about the drug tolerance of the isolate would be very important in the clinic. The reason why it takes extremely long to treat TB is the ability of Mtb to enter a tolerant state when exposed to drugs despite the multidrug strategy. Drug tolerance is defined as an increase of the bacterial survival time to a bactericidal drug without changing the minimal inhibitory concentration (MIC), the lowest concentration of a specific antibiotic needed to prevent growth. Therefore, upon exposure to bactericidal drugs, tolerant mycobacteria are thus killed at a lower rate than the fully susceptible population. In contrast, drug resistance, or the ability to replicate in the presence of a drug that is most specific to a single drug, is inheritable and increases the MIC [18].
Some of the main mechanisms conferring a drug tolerance in Mtb are metabolic slowdown by reducing the metabolism and metabolic shifting by rerouting metabolic fluxes. Clinically, the variation in glpK gene, which is required for glycerol catabolism and essential for growth in media with glycerol as a carbon source, was found to be associated with drug resistance in clinical Mtb isolates [19,20]. Also in vitro, the glpK-deleted strain was less sensitive to INH and RIF than the wildtype strain, suggesting that the variation in glpK gene increases drug tolerance and consequently, may contribute to the evolution of resistance [19]. Another study group has demonstrated that Mtb strain depleted with phosphoenolpyruvate (PEP), a substate of multiple pathways needed for Mtb replication, induced reversible drug tolerance to INH because the supplementation of PEP restored the growth and the drug sensitivity. They have also observed that the abundance of PEP in the clinical Mtb isolates with multidrug-resistance, and XDR was downregulated compared to that of drug-sensitive isolates [21]. This observation suggests that reversible drug tolerance may stimulate the emergence of drug resistance. Therefore, if we can obtain the information about the drug tolerance of the patients’ Mtb isolates, we could predict the efficacy and the appearance of the resistance of that drug. Finally, this will be helpful for the clinicians to make an optimal choice of drug selection in the clinic.
The observations in the present study demonstrate this cytometry method as a potential complementary useful tool for pDST testing. However, our study has some limitations in arriving at a definite conclusion. First, the number of tested isolates is small. This is because we have focused on selecting the isolate having no mutation but phenotypic resistance to drugs and it is rare to find these isolates, particularly in RIF and EMB because the frequency is very low. So, it would be necessary to test a bigger number of isolates for further study. Second, more isolates with various MIC or mutation types may need to be tested to increase the reliability of this method.
Since many clinical laboratories do not have flow cytometry, this could be a challenge for general use of this method but as shown in the present study, it would be a very useful DST testing method for selective use for clinical cases showing opposite DST results. In conclusion, we have evaluated the basic feasibility of the flow cytometry method as another rapid susceptibility test and that this might be a useful assistant tool in TB clinics.
Notes
Authors’ Contributions
Conceptualization: Lee SK, Baek SH, Cho SN, Eum SY. Methodology: Lee SK, Hong MS, Lee JS, Cho EJ, Lee JI. Formal analysis: Lee SK, Eum SY. Writing – original draft preparation: Baek SH, Eum SY. Approval of final manuscript: all authors.
Conflicts of Interest
No potential conflict of interest relevant to this article was reported.
Funding
This study was supported by the “Korea Disease Control and Prevention Agency, Republic of Korea”.