Urine Cotinine for Assessing Tobacco Smoke Exposure in Korean: Analysis of the Korea National Health and Nutrition Examination Survey (KNHANES)
Article information
Abstract
Background
The level of urine cotinine is an indicator of tobacco smoke exposure. The purpose of this study is to investigate urine cotinine for the purpose of assessing the smoking status of Korean smokers and non-smokers exposed to tobacco smoke.
Methods
The subjects were identified from the 2007-2009 and the 2010 data sets of the Korea National Health and Nutrition Examination Survey (KNHANES). They were assigned as non-smokers, current smokers and ex-smokers. Non-smokers were also divided into three subset groups according to the duration of smoke exposure. Each group was stratified by gender prior to analysis.
Results
The median value of urine cotinine in the male current smokers was 1,221.93 ng/mL which was the highest among all groups. The difference between levels of urine cotinine for male and the female groups was statistically significant (p<0.01). In the female group, passive smoke exposure groups reported higher urine cotinine levels than non-exposure groups (p=0.01). The cutoff point for the discrimination of current smokers from non-smokers was 95.6 ng/mL in males and 96.8 ng/mL in females. The sensitivity and specificity were 95.2% and 97.1%, respectively, in males, 96.1% and 96.5% in females. However, the determination of urine cotinine level was not useful in distinguishing between passive smoke exposure groups and non-exposure groups.
Conclusion
Urine cotinine concentration is a useful biomarker for discriminating non-smokers from current smokers. However, careful interpretation is necessary for assessing passive smoke exposure by urine cotinine concentration.
Introduction
Smoking, which includes second-hand smoke, is a significant risk factor for various diseases such as cancers, respiratory diseases, heart problems and various forms of stroke1-3. It also contributes to the patients' death in most cases4. Therefore, exact assessments of the epidemiology of normal populations associated with current smoking status or second-hand smoke are important to control disease and set up public health policy4,5.
Although there are many reports to investigate tobacco smoke exposure, most of assessments are based on self-reported questionnaires. However, there are some limitations in these measures because some respondents answer inaccurately about their smoking habits5-7. Wilcox et al.6 showed that true percentage of previous smokers who actually had quit smoking was between 46% and 53% by biological marker studies. Therefore, objective methods to estimate smoking status and second-hand smoke exposure are needed.
There are many toxic metabolites in tobacco, which have been suggested as biomarkers to assess tobacco smoke exposure. For example, thiocyanate, carbon monoxide, carboxyhemoglobin, hydroxyprolin and aromatic amines can be used. However most of these biomarkers have a low specificity and sensitivity because they are influenced by environmental factors8,9. Therefore, they are not considered to good markers.
Cotinine is major proximate metabolite of nicotine, which is oxidized in the liver by CYP2A6 and distributed in various body fluids including the blood, saliva and urine10. Moreover, cotinine has a much longer half-life (16 to 20 hours) than nicotine (2 hours)1,9 and presents higher concentrations in body fluids than nicotine11. Therefore, cotinine is considered a good biomarker to distinguish non-smokers from current smokers12 and urinary cotinine is a preferred marker because urine can be obtained easily and non-invasively. However, Signorello et al.13 reported that urinary cotinine level was different for various ethnic backgrounds. In Korea, there are several studies about the usefulness of urinary cotinine to assess tobacco smoke exposure in a small number of subjects5,14. The purpose of this study is to investigate the role of urine cotinine for assessing the smoking status of people exposed to tobacco smoke in Korean based on large population study, Korea National Health and Nutrition Examination Survey (KNHANES) investigated from 2007 to 2010.
Materials and Methods
In this study, we use the data set of KNHANES IV (2007~2009) and the first year of KNHANES V (2010). The KNHANES is a nationwide survey that included 500 survey areas drawn from the census populations and housing units by considering the proportion of each subgroup. This survey was executed by the Centers of Disease Control (CDC) of Korea to get statistically reliable and representative data, which include health, food, and lifestyle of the Korean population. Trained interviewers administered a questionnaire on the smoking status and other health information. There were 9 questions and 7 sub-questions about smoking and 33,829 subjects answered those questions. Subjects' age was reclassified to 4 subsets (18~24, 25~44, 45~64, and ≥65).
Smoking status was divided to three groups: non-smokers, current smokers, and ex-smokers. Non-smokers included both never smokers and smokers who had smoked under 100 cigarettes in their lifetime. Non-smokers were also divided to three groups according to their passive tobacco exposure time: non-exposure, exposure less an hour, and exposure over an hour per day groups. Tobacco smoke exposure was investigated at the working place and home. If subjects were exposed to tobacco smoke for less an hour in both places, we assigned them as the exposures for over an hour group.
On the other hand, we are able to assume that the urine cotinine concentration is higher in the men because a lot of men tend to smoke more than women. This hypothesis suggests the cutoff value to distinguish smokers from non-smokers can be different between men and women. Therefore each group was stratified by gender before analysis.
There were 33,829 subjects who replied on their smoking-related questions. According to the above criteria, 14,315 (42.3%), 4,973 (14.7%), and 3,088 (9.1%) subjects were assigned to the non-smokers, current smokers, and ex-smokers, respectively. In the same way, 14,315 subjects who answered the questionnaires, the subjects with non-exposure, exposure for less an hour, and over an hour group were assigned to 159 (1.1%), 770 (5.4%), and 1,673 (11.7%) persons, respectively.
Urine cotinine level was measured by gas chromatography mass spectrometry using the Perkin Elmer Clarus 600T (PerkinElmer, Turku, Finland). All data were measured in a standardized manner and reviewed by central quality control center.
All statistical analyses were performed with SAS version 9.2 (SAS Institute Inc., Cary, NC, USA). The difference of urine cotinine level between each group was analyzed by the Kruskal-Wallis test because the level of urine cotinine did not follow a normal distribution. The statistical significance was considered by the p-value of less than 0.05. Logistic regression analysis and receiver operating characteristic (ROC) curve estimated the cutoff point to discrinimate between current smokers and non-smokers. The cutoff point was determined by Youden method.
Results
There were 9,034 men (40.4%) and 13,342 women (59.6%) in the final study population. Current smokers and ex-smokers were predominant in the male population-85.2% and 85.7%, respectively. The portions of non-smokers were much higher (85.0%) in the female. The mean age was 48.9 (±16.6). The age of most subjects was between 25 and 64. Urine cotinine level ranged from 0.009 ng/mL to 7,817.46 ng/mL. The median value of urine cotinine was highest in the current smokers (1,177.39 ng/mL). Men had higher cotinine level than women in all three groups. The median value and interquartile range of blood urea nitrogen and creatinine were similar in all groups. Other characteristics are summarized in Table 1.
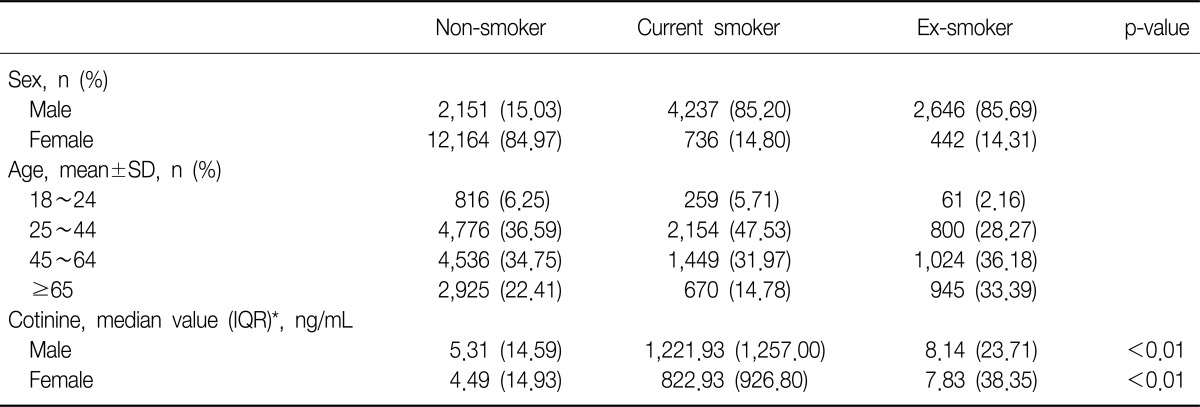
Characteristics of subjects stratified by smoking status
Two thousand and six hundred two subjects of the 14,315 non-smokers replied with their tobacco smoke exposure rate. A higher rate of smoke exposure was observed in females for both less an hour and over an hour exposure groups. The median value of urine cotinine was highest in the tobacco smoke exposure over an hour groups, 10.22 ng/mL. These details are in Table 2.
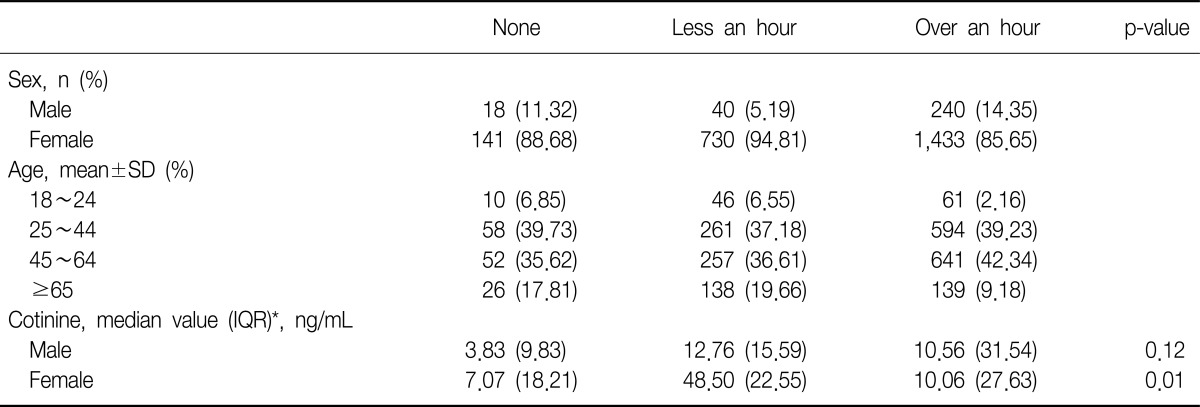
Duration of daily passive smoke exposure among non-smokers
The median value of urine cotinine was significantly different among the groups sorted by smoking status (p<0.01). In the analysis of the subgroups divided according to the gender, all groups had shown statistical distinction (p<0.01). The current smokers had higher level of urine cotinine compared with that of the other groups (Table 1, Figure 1).
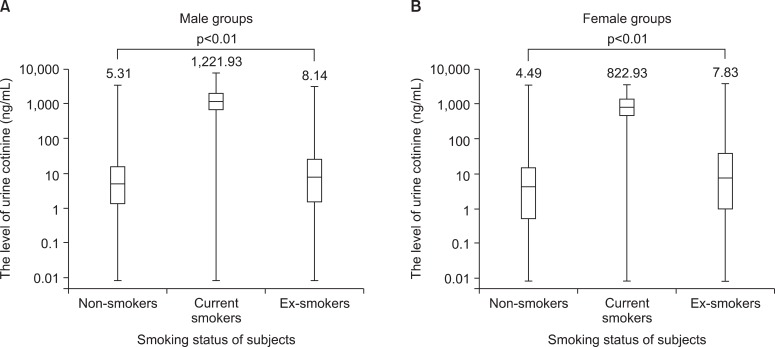
(A, B) Median values for urine cotinine among non-smokers, current smokers and ex-smokers.
Among the non-smokers, we found that the duration of tobacco smoke exposure could be possible to attribute to the level of urine cotinine (p<0.01). However, the duration of passive smoke exposure could not show the difference of urine cotinine level in the men (p=0.20). The level of urine cotinine of tobacco smoke exposure in the over an hour groups was higher compared with that of the other groups (Table 2, Figure 2).

(A, B) Median values for urine cotinine between non-exposure and passive exposure status in non-smokers.
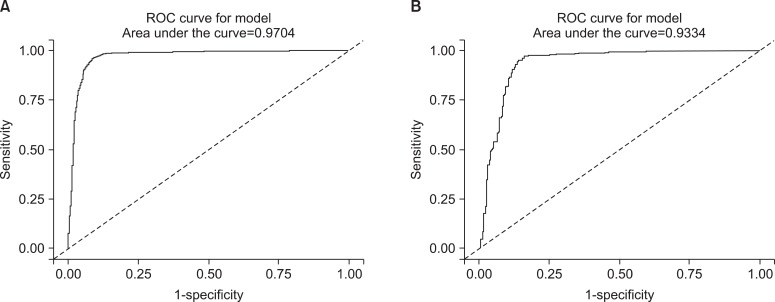
To set the cutoff value to distinguish between non-smokers and current smokers, we used ROC curves. Area under the curve (AUC) of the ROC curves revealed 0.981 in the male subgroups, therefore the level of urine cotinine was considered a valuable marker for discrimination (Figure 3A). The 95.5 ng/mL of cutoff value showed 95.2% of sensitivity and 97.1% of specificity (Table 3). In the female subgroups, urine cotinine was a reliable marker to determine whether female subjects were smokers or not because the value of AUC was 0.979 (Figure 3B). The cutoff point was 96.8 ng/mL with 96.1% of sensitivity and 96.5% of specificity (Table 3).
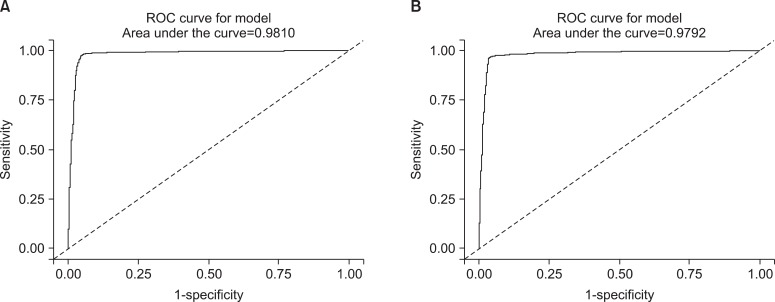
The receiver operating characteristic (ROC) curves of urine cotinine for determining the cutoff value used to distinguish between current smokers and non-smokers. (A) The curve represents the male group and (B) the curve represents the female group.
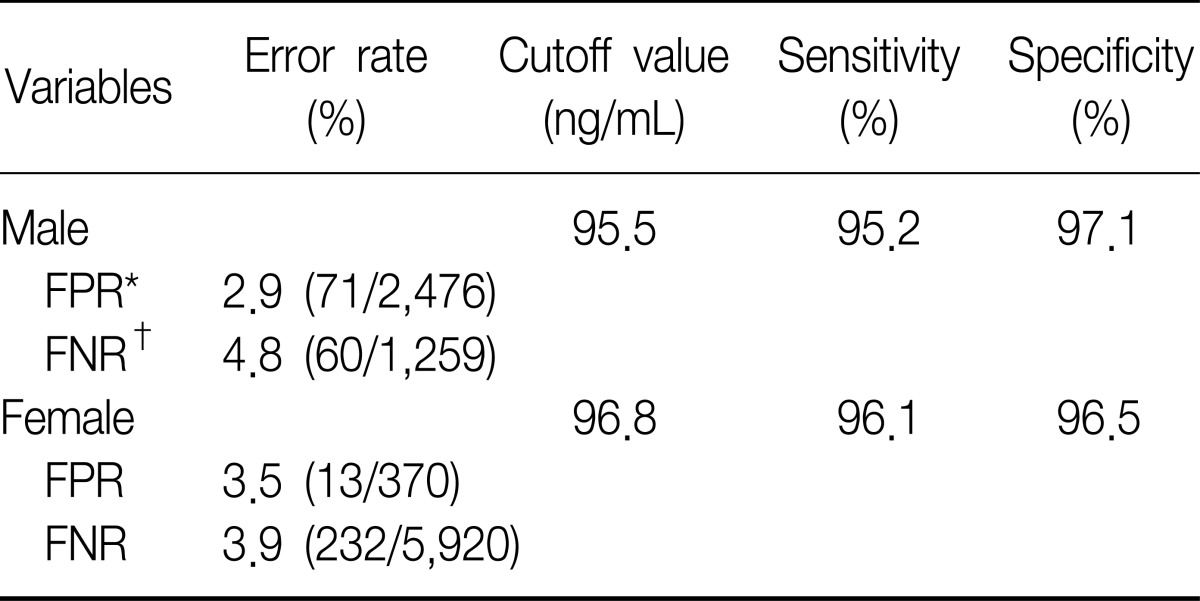
The cutoff values of urine cotinine used to distinguish non-smokers from smokers
In addition to this result, we excuted same analysis between ex-smokers and current smokers. We obtained the similar result and those were presented on Table 4 and Figure 4. However the ROC curve drawn with non-smokers and ex-smokers did not show usefulness to get cutoff value to seperate them (Figure 5).
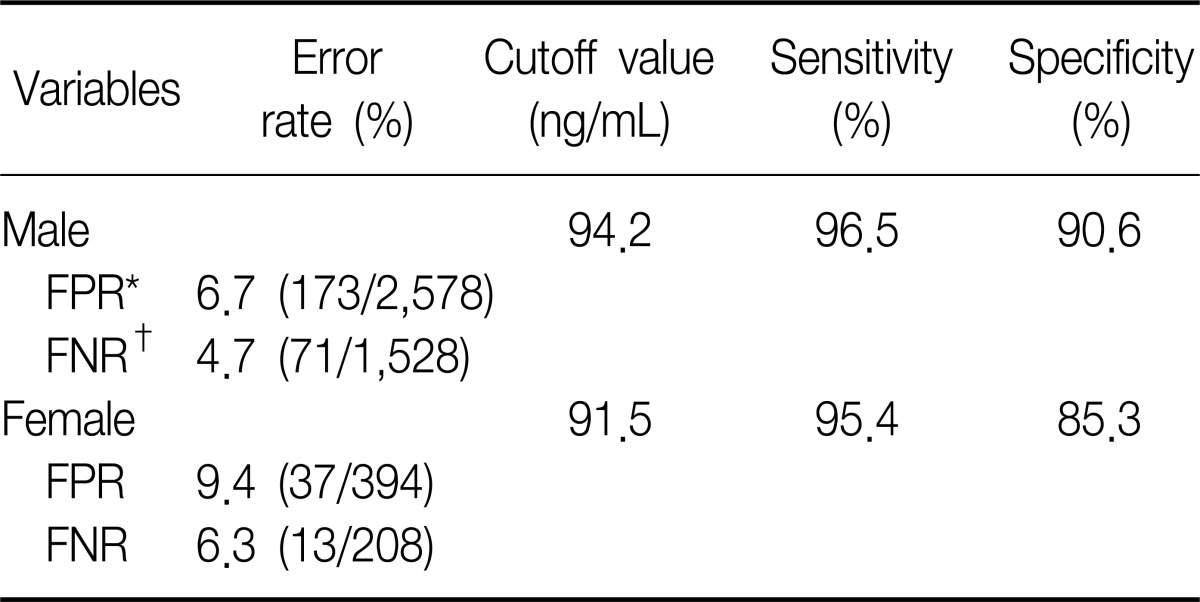
The cutoff values of urine cotinine used to distinguish ex-smokers from smokers
The receiver operating characteristic (ROC) curves of urine cotinine for finding cutoff value to distinguish current smokers from ex-smokers. (A) The curve represents the male group and (B) the curve represents the female group.

The receiver operating characteristic (ROC) curves of urine cotinine for determining the cutoff value used to distinguish ex-smokers from non-smokers. (A) The curve represents the male group and (B) the curve represents the female group.
In the analysis of non-smokers to distinguish passive exposure groups from non-exposure groups, the level of urine cotinine was not statistically significance. The AUC was 0.667 in the male non-smokers and 0.562 in the female non-smokers (Figure 6). Therefore, the cutoff point of urine cotinine to discriminate passive smoke exposure from non-exposure was invalid.
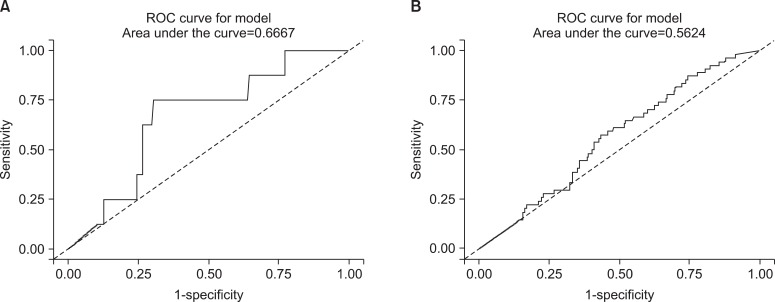
The receiver operating characteristic (ROC) curves of urine cotinine for determining the cutoff value used to distinguish non-exposure groups from passive smoking exposure groups. (A) The curve represents the male group and (B) the curve represents the female group.
Discussion
In this study, we found that the level of urine cotinine was higher in the men compared with that of women. The difference of urine cotinine between smokers and non-smokers was statistically significant (p<0.01 both in the male and female groups). Therefore urine cotinine level could be a good marker to distinguish current smokers from non-smokers both male and female groups. The cutoff value of urine cotinine to determine whether the one is smoker is 95.5 ng/mL for males and 96.8 ng/mL for females. These values were detemined by ROC curve analysis with Youden method. Similarly 94.2 ng/mL in the men and 91.5 ng/mL in the female will be used to cutoff value to distinguish current smokers from ex-smokers. This results appropriated previously mentioned hypothesis that men had higher urine cotinine level compared with women because men smoked much more then women and cutoff value would be different between men and women.
However, urine cotinine was not able to discriminate neither ex-smokers nor passive smokers from non-smokers. These results could be explained with half life of cotinine. Because the half life of cotinine is less than 24 hours, we cannot detect higher level of cotinine from ex-smokers who quit tobacco recently.
Wall et al.15 reported that urine cotinine level was higher in smokers than non-smokers, and tended to increase to the total amount of smoke exposure proportionally in their study with 98 subjects. However, he did not propose a cutoff value to distinguish between each other. Vine et al.16 also showed similar results in their study with 88 subjects. Urine cotinine level was higher compared with that of any other body fluids and raised with an increase of tobacco smoke exposure16. Jee et al.14 investigated 99 high school students and concluded that the cotinine level correlated with smoke exposure, and suspected that urine cotinine level could reflect chronic exposure of cigarettes.
Jarvis et al.7 presented the cutoff value of urine cotinine to discriminate between true smokers and non-smokers as 49.7 ng/mL with 97% of sensitivity and 99% of specificity. In addition, they concluded that cotinine provided the best results of discrimination and urine cotinine could be used clinically7. Haufroid and Lison9 suggested the discrimination threshold of urine cotinine between active and passive smokers to be between 20 to 100 ng/mL because non-smokers' urine cotinine level did not exceed 100 ng/mL in several studies. Zielińska-Danch et al.17 recommended that the cutoff level of urine cotinine to be 550 ng/mL to discriminate non-smokers from current smokers. Furthermore, the level of 170 ng/mL could distinguish non-exposure groups and light smoke exposure groups from heavy smoke exposure groups. Finally, urine cotinine level of less than 50 ng/mL could determine non-smoke exposure17.
In this study, we reported the cutoff value of 95.5 ng/mL in the men and 96.8 ng/mL in the women. This is higher level of urine cotinine compared with which was investigated previously. Because the urine cotinine level has racial variation13, we can assume that the urine cotinine level in the Korean smokers can be different from those of other studies.
Kwon et al.18 said that the cotinine formation from the nicotine was related to genetic polymorphism of cytochrome P450 (CYP) 2A6. According to those reports, Koreans tended to have higher cotinine level than that of the Japanese because of higher allele frequencies of CYP 2A6*1A, CYP2A6*1B. Although most Asians had similar allele frequencies of CYP 2A6, the Caucasians showed higher allele frequencies which decreased the metabolic rate of nicotine18. This can be the reason why our study shows a higher cutoff value compared to that of other studies.
In addition, the different methods to measure urine cotinine were used in each research. As mentioned eariler, we used gas chromatography mass spectrometry using the Perkin Elmer Clarus 600T. Although Jarvis et al.7 used gas chromatography without adjustment urine flow, Haufroid and Lison9 measured urine cotinine level with colorimetric methods and Zielinska-Danch et al.17 used liquid chromatography modified by Nakazima who was Japanese researcher19. Therefore these differences could be possible causes of that result.
Our study has some limitations. First, our data from KNHANES were based on self-reported surveys. Therefore it is possible that current smokers say that they are non-smokers and vice versa. Kang et al.5 contacted people who reported being non-smokers but who had high urine cotinine level again about their smoking status and could verify true non-smokers and heavy passive smokers. Contrary to this, we were not able to re-check the smoking status too large sample size among non-smokers whose urine cotinine level was high. Second, a few people reported using nicotine replacement therapy to quit tobacco smoking. These people could have elevated cotinine level because of continous supply of nicotine.
However, this study was based on large population compared with the other studies in Korean. Therefore we can generalize the results. If we reset the cutoff value of urine cotinine 41 ng/mL in the men, we can obtain 90.5% of sensitivity and 98.6% of specificity. Likewise the cutoff value of 300 ng/mL will give us 96.9% of sensitivity and 90.1% of specificity in the male groups. This means people can modify the cutoff value on their purpose. In other words, we can use higher cutoff value up to 300 ng/mL to maximize sensitivity. This value can be used to distinguish non-smokers from smokers to give advantages to non-smokes. In contrast, the lower cutoff value near 41 ng/mL will be used to maximize specificity and can be used to anti-smoking clinic to discriminate current smokers from who stop smoking. However, we failed to show the usefulness of urine cotinine level to discriminate non-exposure from passive smoke exposure among non-smokers. This result is similar to those of Lee et al.20 and Caraballo et al.21.
In conclusion, urine cotinine is a useful biomarker to discriminate current smokers from non-smokers. The cutoff value to discriminate current smokers from non-smokers will be modified by the aim of distinguish. More studies are needed to find out biomarkers to distinguish passive smoke exposure.