

Introduction
Spirometry test is a very important tool in assessing overall pulmonary health status and a clinical test used widely for diagnosis and clinical evaluation of respiratory diseases, epidemiological investigations and clinical researches1. In recent days, the use of spirometry is gradually increasing in epidemiological investigations on health problems related with inhalation of environmental harmful materials.
Most countries have their own estimation models for the prediction of pulmonary function indexes, and the predictive values are used as the diagnostic criteria for abnormal lung function. USA has induced various regression models for pulmonary function parameters according to different ethnic groups and gender2, which has been widely used not only in USA but in Korea as well. In Korea, there have been a few studies inducing predictive regression models for pulmonary function parameters in general population3,4. Choi et al.4 had presented predictive models which were induced with spirometry data from 4,816 subjects of the 2001 Korean National Health and Nutrition Examination Survey. Different variables were used in the Korean and the American regression models for forced vital capacity (FVC) and forced expiratory volume in one second (FEV1). Choi et al.4 had used age, height and body weight as independent variables in the models for FVC and FEV1. In contrast, Hankinson et al.2 had age and height only, excluding the body weight from the variables. Predictive values were also different. The values for Americans were greater than those for Koreans in younger adults under 40 years of age, but smaller in 40 years old or older individuals. In over 50 years of age group, the gap between the two predictive values gets wider as age increases. Therefore, which model is used as the reference for spirometry test of individuals older than 40 years of age is a major determinant of the prevalence of ventilatory impairment.
The USA regression models are now being widely used as the references for spirometry test results of Koreans. This fact leads to a necessity for examination of goodness-of-fits of the Korean and the USA regression models to spirometric data of healthy Korean adults. The purpose of this study is to compare the goodness-of-fits of the Korean and USA regression models to spirometry data of Korean subjects who lived in Chungbuk Province.
Materials and Methods
1. Study subjects
From July 1, 2010 to August 11, 2010, the authors conducted an environmental epidemiological investigation on the health effects of dust and gas emitted from cement plants located in Jecheon-si and Danyang-gun, Chungbuk Province, Republic of Korea. As a part of this investigation, the respiratory function tests were performed to subjects who were 40 years old or older, and lived in the vicinity of the cement plants.
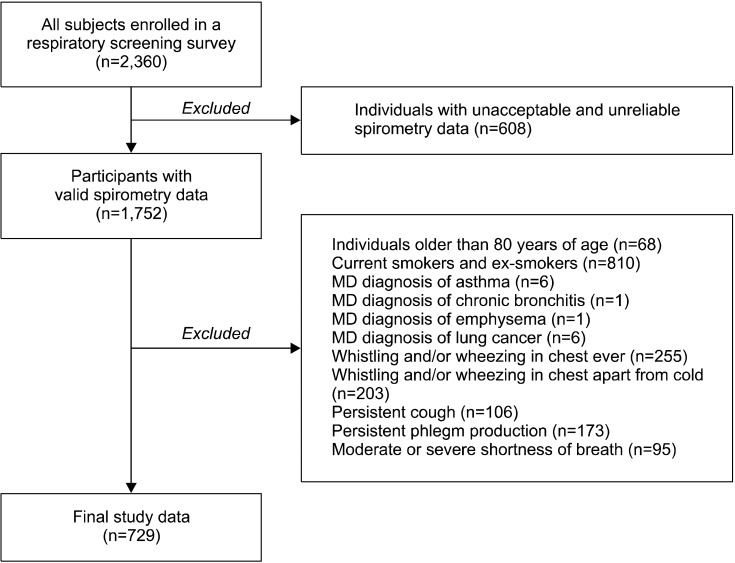
A questionnaire was implemented to gather information on demographic characteristics, smoking and drinking habits as well as respiratory symptoms, which was followed by the respiratory examination in the order of spirometry test, chest radiography and physical examination. Voluntarily, 2,360 adults (1,124 males and 1,236 females) were participated in this examination. After the investigation was completed, 6 experts determined on the validity of the spirometry tests and then excluded 608 individuals whose spirometric tests were not valid. As the result, 1,752 individuals had moved unto the next stage (Figure 1).
2. Investigation methods
1) Questionnaire survey and measurement of heights and body weights
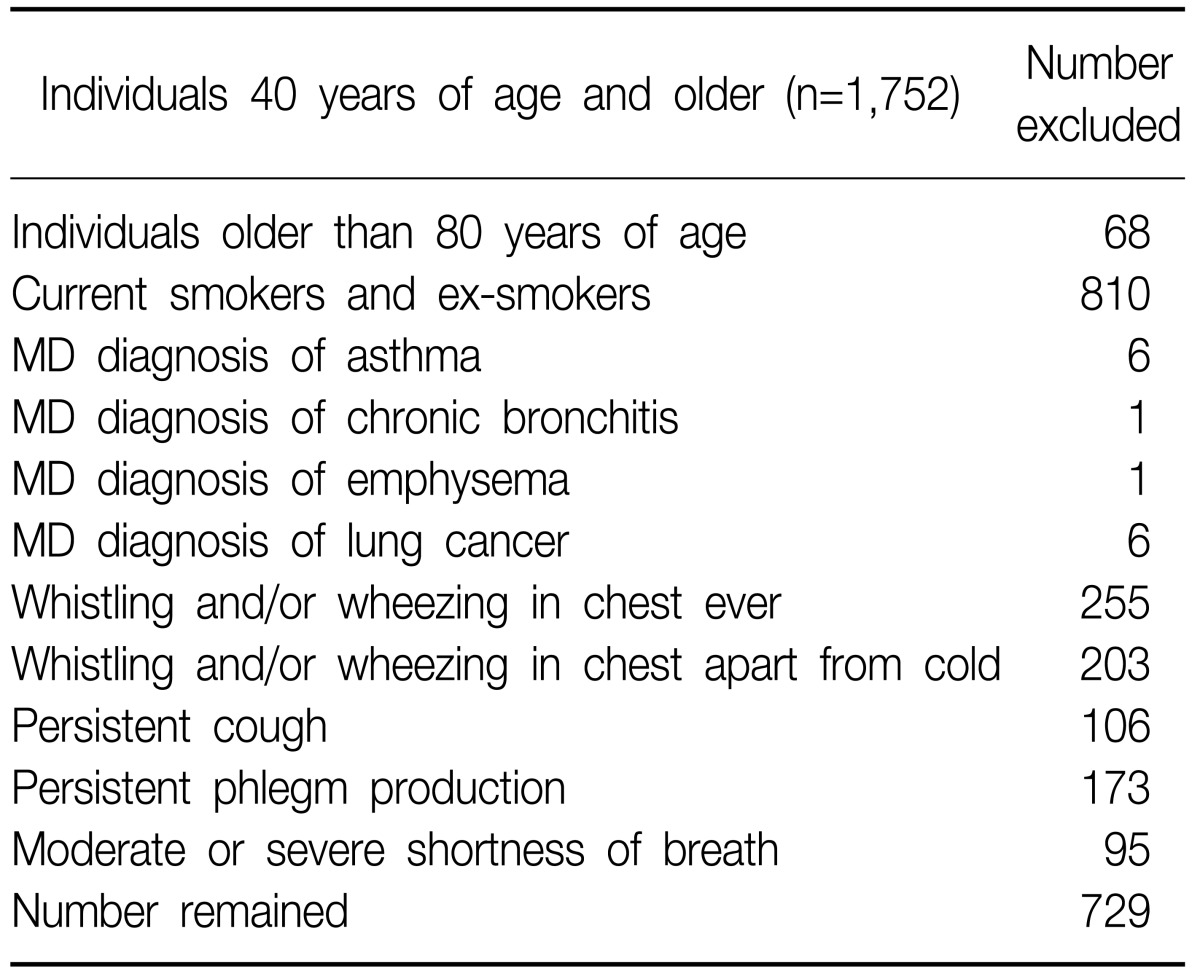
Using a structured questionnaire, information was gathered on the demographic factors, smoking habit, occupational history, past medical history, and presence/absence of respiratory and cardiac diseases at the time of test. Thereafter, height and body weight of the subjects were measured. For height measurement, every subject was asked to put off the shoes, mount on an extensometer gathering heels and stand to adhere his/her back to the vertical axis of extensometer. Because the investigation was performed in summer, the subject's weight was measured as they wore light casual clothes without outers. Based on the results of questionnaire survey, those applicable to any of the followings (Table 1) were excluded.
Finally, data of 729 individuals (105 males, 624 females) was included in the statistical analysis (Figure 1).
2) Chest radiography
The thoracic radiography was taken using a digital radiography system (Digi SPOT DR-XG; Sitech Medical, Virginia Gardens, FL, USA), and the images were read by two specialized radiologists. When there was any discrepancy between the radiologist's diagnoses, another radiologist performed additional reading for final determination.
3) Spirometry test
Spirometry test was performed using Micro Quark PC-based Spirometers (Cosmed, Rome, Italy) according to the guidelines of American Thoracic Society and European Respiratory Society for accuracy and reliability1. In the spirometry test, FVC, FEV1, and peak expiratory flow rate (PEFR) were measured. All the spirometers were calibrated using a 3 L calibration syringe every morning before starting examination and every 4 hours. The air temperature and humidity of the testing venue were measured and the values were entered into the laptop system connected to the spirometers.
Before testing, an explanation on spirometry test was given to the subjects. Spirometry tests were repeated until the reproducibility and goodness of the test reached the criteria of American Thoracic Society and European Respiratory Society. First, there should be no coughing during the 1st second of expiration, no glottic obstruction influencing measurement results, no early completion, no early cut-off, no air leak and no mouthpiece blocking. Secondly, the subject did his/her best without hesitation in starting expiration, and the extrapolated volume at the beginning of expiration should be less than 5% of FVC or 0.15 L. Thirdly, the subjects should exhale over 6 seconds or until the volume-time curve had reached to the plateau or no more expiration was possible. When the discrepancy between the best value and the second best value among best 3 FVC measurements were within 0.15 L, and, at the same time, the discrepancy between the best value and the second best value among best 3 FEV1 measurements was within 0.15 L, the spirometry test result was determined as valid. All subjects had been tested Ōēź3 times at least, and nearly all subjects were tested more than 5 times. Since the flow-volume curve and the flow-time curve were displayed on the monitor while spirometry test was in-progress, testers and testees could check expiration time. At each time of test completion, the computer determined the validity of the test, and all valid test results were numerically saved in the computer. When the best FEV1/FVC% was less than 70%, re-test was performed after inhalation of a bronchodilator according to the decision of the examining physician.
After completion of spirometry test, the flow-volume curve and the flow-time curve, the test results for FVC, FEV1, PEFR and the reference value of National Health and Nutrition Examination Survey (NHANES III) were printed out and submitted to the examining physician, who determined if any additional tests or inhalation of bronchodilator would be required. In this study, 3 to 4 testers conducted spirometry test at the same time using spirometers of the same model, and less than 40 subjects were allocated to every tester per day.
The best FVC and the FEV1 were selected respectively from 3 or more accurate and reproducible tests. After the spirometry tests were completed for all subjects, 6 experts in spirometry test had determined whether the each test result was compatible to the accuracy and reproducibility criteria of American Thoracic Society.
4) Statistical analysis
Predictive values of FVC and FEV1 were calculated by applying parameters such as age, height and weight of the subjects to the Korean regression models and to the USA Caucasian regression models, and compared to actually measured FVC and FEV1. A paired t-test was used for statistical comparison between those mean values. Scatter diagrams for the FVC and FEV1 values measured, those estimated using the Korean regression models and those estimated using the USA Caucasian regression models according to age or height changes were drawn for males and females, respectively. Trend lines for measured values, those for estimated values using the Korean regression models and those for estimated values using the USA Caucasian regression models were added to the scatter diagrams. Sum of squares of differences between the measured value and the predictive values of the two regression models (sum of square due to error [SSE]) and sum of squares of differences between the mean of measured values and the estimated values of the two regression models (total sum of square [SST]) were obtained respectively and the goodness-of-fits for those models were statistically tested. To test validities of the regression models, we used the following equation including SSE and sum of square due to regression (SSR) which equals to SST minus SSE, and an F-test.

F-values obtained by the following equation were utilized to compare the goodness-of-fits of the two regression models.

Results
Means and standard deviations of age, height, weight, and measured and estimated FVC and FEV1 values of the study subjects are presented in Table 2. The means of estimated values derived from the Korean models overestimated more than those from the USA models on all occasions.
Scatter diagrams and trend lines for the FVC and FEV1 values measured, those estimated using the Korean regression models and those estimated using the USA Caucasian regression models according to age or height changes were shown in Figure 2 (males) and Figure 3 (females).
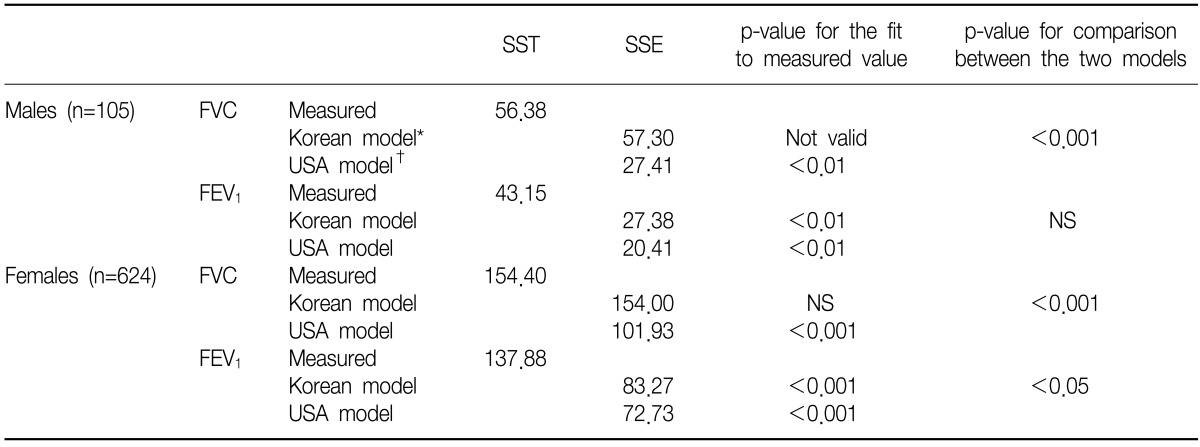
Since the SSE of the Korean regression model for FVC in the male subjects of this present study was greater than its SST, the Korean regression model for FVC turned out to be not valid for males (Table 3). For FEV1, whereas, the goodness-of-fits of the Korean male model and the USA male model were statistically significant (p<0.01).
The SSE of the Korean model for FVC in males was significantly greater than that of the corresponding USA model. For FEV1, the SSEs of the Korean and the American models did not show any statistical difference (Table 3). In females, the USA regression models were valid for FVC and FEV1, but the Korean model was not for FVC. The SSEs of the USA models for FVC and FEV1 were significantly smaller than the corresponding Korean models.
Discussion
The FVC and FEV1 values of the Korean regression models for the male subjects of this study were higher than the measured values by 12.5% for FVC and by 3.5% for FEV1, respectively. Whereas, the values estimated with the USA Caucasian regression models were higher only by 5.7% for FVC and by 0.6% for FEV1. This means that FVC and FEV1 estimated using the USA Caucasian models were closer to the measured values than those using the Korean models. In particular, the means of FEV1 measured and FEV1 estimated using the USA male models were almost same. Female data showed a similar pattern, but sizes of overestimation of the Korean models were larger than in males. The difference between the mean of measured FEV1 and that of FEV1 estimated using the American female model was only 0.4%.
Because of the larger difference between the measured FVC value and the FVC estimated with the Korean regression model, if the Korean model is used as a reference, then more subjects would be classified as restrictive ventilatory impairment. Moreover, the larger difference between the measured and estimated FVC values than that between those FEV1 values lead to an increase in the number of subjects to be classified as obstructive ventilatory impairment. Those over-diagnoses would be more prominent in females than in males.
The regression curves for the American model were closer to the curves for measured values than those for the Korean models not only in the FVC and FEV1 scattergrams including age in the X axis but also in those graphs including height as the X variable. The regression curves for measured FEV1 and for FEV1 estimated with the USA Caucasian regression model almost overlapped each other. Taking into account the minimal difference between the mean values of measured FEV1 and estimated FEV1 using the USA models, these USA models would be more appropriate as the reference for Koreans than the Korean models.
Because the SSR of Korean model for FVC was nearly equal to the SSE, the R-square of the model is actually 0. This means that the Korean models for FVC do not fit to measured FVC data of this present study at all. In case of FEV1, the Korean regression models showed significant goodness-of-fits. The goodness-of-fits of the USA regression models were statistically significant for both FVC and FEV1 in both males and females, and the R-squares of the models were higher than corresponding Korean models. When compared to the Korean regression models, all SSEs of the USA regression models, but that for FEV1 in males, were significantly smaller. These facts suggest that these USA regression models are more appropriate as the references for spirometry tests of Koreans. On the contrary, if values estimated with the Korean regression model are used as the reference values, more ventilatory impairment cases would be diagnosed. This is consistent with the study results that the prevalence of ventilatory impairment changed greatly according to the referent model taken5.
As this study was conducted in a limited region with a relatively small sample size, it is not recommended to generalize the results of this present study to Korean population. Therefore, we did not present any regression model for the spirometric data of this study.
In conclusion, the USA Caucasian regression models showed a better fit to spirometry test data of this study than the Korean regression models did. New regression models with better goodness-of-fits for Korean general population should be introduced.


 PDF Links
 PubReader
 Full text via DOI
 Print
Print Download Citation