Tuberc Respir Dis > Volume 87(1); 2024 > Article
Choi, Lee, Byun, Park, Park, Park, Kim, Kim, Lim, Yoo, Jung, and Park: Roles of Inflammatory Biomarkers in Exhaled Breath Condensates in Respiratory Clinical Fields

Abstract

Background

Exhaled condensates contain inflammatory biomarkers; however, their roles in the clinical field have been under-investigated.

Methods

We prospectively enrolled subjects admitted to pulmonology clinics. We collected exhaled breath condensates (EBC) and analysed the levels of six and 12 biomarkers using conventional and multiplex enzyme-linked immunosorbent assay, respectively.

Results

Among the 123 subjects, healthy controls constituted the largest group (81 participants; 65.9%), followed by the preserved ratio impaired spirometry group (21 patients; 17.1%) and the chronic obstructive pulmonary disease (COPD) group (21 patients; 17.1%). In COPD patients, platelet derived growth factor-AA exhibited strong positive correlations with COPD assessment test (ρ=0.5926, p=0.0423) and COPD-specific version of St. George’s Respiratory Questionnaire (SGRQ-C) score (total, ρ=0.6725, p=0.0166; activity, ρ=0.7176, p=0.0086; and impacts, ρ=0.6151, p=0.0333). Granzyme B showed strong positive correlations with SGRQ-C score (symptoms, ρ=0.6078, p=0.0360; and impacts, ρ=0.6007, p=0.0389). Interleukin 6 exhibited a strong positive correlation with SGRQ-C score (activity, ρ=0.4671, p=0.0378). The absolute serum eosinophil and basophil counts showed positive correlations with pro-collagen I alpha 1 (ρ=0.6735, p=0.0164 and ρ=0.6295, p=0.0283, respectively). In healthy subjects, forced expiratory volume in 1 second (FEV1)/forced vital capacity demonstrated significant correlation with CC chemokine ligand 3 (CCL3)/macrophage inflammatory protein 1 alpha (ρ=0.3897 and p=0.0068). FEV1 exhibited significant correlation with CCL11/eotaxin (ρ=0.4445 and p=0.0017).

Conclusion

Inflammatory biomarkers in EBC might be useful to predict quality of life concerning respiratory symptoms and serologic markers. Further studies are needed.

Introduction

Exhaled breath condensate (EBC) can be noninvasively collected from the respiratory tract with simple procedures. EBC contains detectable various inflammatory biomarkers and might reflect airway inflammation. In EBC, measurable biomarkers and parameters include pH, magnesium, H2O2, cytokines, leukotrienes, and nitric oxide products [1]. Studies have attempted to define the roles of inflammatory biomarkers in clinical fields. Chronic obstructive pulmonary disease (COPD) and idiopathic pulmonary fibrosis have been examined, and several studies demonstrated the clinical meaning of EBC [2,3]. Gessner et al. [2] reported significantly elevated levels of EBC cytokines (interleukin [IL]-1β, IL-6, IL-8, IL-10, IL-12p70, tumor necrosis factor α [TNF-α]) in acute exacerbation compared to stable COPD patients. Jaskiewicz et al. [3] reported the potential usefulness of vascular endothelial growth factor (VEGF)-A as a marker in idiopathic pulmonary fibrosis. In addition, previous studies have reported on the role of EBC in asthma. Among EBC biomarker, the fractional exhaled nitric oxide (FeNO) reflects eosinophilic inflammation in the airway and has been used to guide asthma treatment [4].
These studies reported the potential utility of EBC biomarkers in various respiratory conditions, offering valuable insights for future research and clinical applications. However, the roles of EBC in the clinical field have not been sufficiently investigated to date. Beyond specific respiratory diseases, the clinical characteristics reflected by EBC biomarkers are unknown. There is a lack of pilot studies on whether EBC biomarkers will represent other physiological and serological markers in the future.
This pilot study aims to assess the potential clinical value of EBC in individuals with COPD and those who are healthy. The study focuses on analysing correlations between EBC and various factors, including symptoms, lung function, and clinical indicators.

Materials and Methods

1. Subjects

The Korean Chronic Obstructive Pulmonary Disorders Subgroup Study (KOCOSS) cohort is a multicentre-based, prospective cohort in Korea. Enrolment of this cohort started in December, 2012. This cohort includes a range of clinical and laboratory data. Since September 2021, this cohort extended enrolment criteria and enrolled healthy controls, preserved ratio impaired spirometry (PRISM), COPD in young age, and COPD patients. Exhaled condensates have been collected at available institutes. We used data from 123 subjects enrolled in this cohort between September, 2021 and December, 2022.

2. Exhaled breath condensates

We prepared the cooling sleeve and RTube before taking samples. We placed the cooling sleeve over the outside of the collection chamber. The subjects immediately begin breathing in and out through the RTube mouthpiece. The one-way valve directed the exhaled air through the cooling sleeve where the sample were collected. After 5 to 7 minutes of tidal breathing, sample collection was ended. After detachment of the mouthpiece, we placed the cap on the end of the RTube. We used the plunger to collect EBC into the cap at the top of the RTube. Collected samples were stored in a freezer (0°C).

3. Cytokines

We analysed levels of six biomarkers using conventional enzyme-linked immunosorbent assay (ELISA) and 12 biomarkers using multiplex ELISA. Levels of IL-6, IL-5, IL-8, IL-1β, transforming growth factor β (TGF-β), and TNF-α in EBC were measured using an ELISA (R&D system, San Diego, CA, USA). We prepared all reagents for chitinase 3-like 1, CC chemokine ligand 3 (CCL3)/macrophage inflammatory protein 1 (MIP-1) alpha, CCL11/eotaxin, CXC chemokine ligand 2 (CXCL2)/growth-regulated protein (GRO)-β/MIP-2/cytokine-induced neutrophil chemoattractant 3 (CINC-3), matrix metalloproteinase 12 (MMP-12), pro-collagen I alpha 1, IL-33, granulocyte-macrophage colony-stimulating factor (GM-CSF), VEGF, IL-17/IL-17A, platelet derived growth factor (PDGF)-AA, and thymic stromal lymphopoietin, as instructed. We added 50 μL of standard or exhaled condensates and 50 μL of diluted microparticle cocktail to each well. Incubation was conducted for 2 hours at room temperature on shaker at 800 rpm. We repeated washing thrice and added diluted biotin-antibody cocktail to each well. Incubation on the shaker and washing were conducted thrice. Streptavidin-phycoerythrin was added, incubated, and washed. After incubation with wash buer, we read within 90 minutes using a Luminex (Austin, TX, USA) or Bio-Rad analyser (Hercules, CA, USA).

4. Clinical data

Additionally, we used electronic medical records, including demographics and characteristics. COPD assessment test (CAT) and the COPD-specific version of St. George’s Respiratory Questionnaire (SGRQ-C) were used to assess the severity of symptoms recorded in KOCOSS [5]. The SGRQ-C is a 14-item questionnaire that can be summarised as a total score as well as in three component scores: symptoms, activities, and impacts. Total and component scores were calculated according to algorithms provided in the SGRQ-C instruction manual. The CAT score was used to evaluate dyspnoea. It consists of eight items, each scored from 0 to 5, with higher scores indicating more severe symptoms. Furthermore, pulmonary function and serologic test results, which were included in KOCOSS, were analysed. COPD in young age, COPD, and PRISM were defined based on KOCOSS. COPD was diagnosed when post-bronchodilator forced expiratory volume in 1 second (FEV1)/forced vital capacity (FVC) was less than 0.7. Young COPD was defined as the COPD subject being younger than 50 years old [6]. PRISM was defined as post-bronchodilator FEV1 <80% predicted and FEV1/FVC ≥0.7 [7].

5. Ethics

This study was approved by the Institutional Review Board of Gangnam Severance Hospital (number: 3-2012-0284 and 3-2022-0298), and we obtained written informed consent from all subjects.

6. Statistical analysis

Between-group comparisons of categorical variables were performed using the chi-square test or Fisher’s exact test. Based on the Shapiro-Wilk test, parametric and non-parametric continuous variables were compared using one-way analyses of variance with Bonferroni post-hoc tests and Kruskal-Wallis rank sum test, respectively. Spearman rank correlation coefficient (Spearman’s rho: ρ) was analysed for non-parametric correlation [8]. Additionally, local regression analysis (locally estimated scatterplot smoothing [LOESS]) was performed to assess non-monotonic correlation and fit a spline curve on the scatter plot of the variables. R-squared (R2) value was analysed using Efron’s pseudo-R-squared, also known as Efron’s R2. All correlation analyses were also conducted using subgroup analysis for healthy control and COPD group. Receiver operating characteristic (ROC) curve analysis was performed to assess the ability of biomarkers in predicting abnormalities in pulmonary function tests or serologic tests. The area under the curve (AUC) was calculated to assess the sensitivity and specificity of biomarkers. The optimal cut-off was defined using Youden’s J statistic. A p<0.05 was regarded as indicating statistical significance. In Spearman correlation analysis, correlations with ρ<0.4000 are regarded as indicating weak or negligible correlation [9].
Statistical analyses were conducted using R version 4.0.2 (R Foundation for Statistical Computing, Vienna, Austria) software. Spearman correlation and local regression (LOESS) were analyzed using the “stats” (version 4.3.1) package. The Efron’s pseudo-R-squared was analyzed using the “rcompanion” (version 2.4.30) package. For ROC curve analysis, the “ROCR” (version 1.0-11) and “pROC” packages (version 1.18.0) were used.

7. Availability of data and material

The datasets used and analysed during the current study are available from the corresponding author on reasonable request.

Results

1. Baseline and clinical characteristics of subjects

Among 123 subjects, 94 (76.4%) were male. The mean age of all subjects was 60.2 years. Healthy controls constituted the largest portion of the total subjects (81 participants; 65.9%), followed by PRISM (21 patients; 17.1%), COPD (17 patients; 13.8%), and COPD in young age (four patients, 3.3%) group.
The baseline characteristics of the participants are described in Table 1. There were no significant differences in age, sex, weight, height, body mass index (BMI), and smoking history among the control, PRISM, and COPD groups. In symptom evaluation, the CAT scores (median [interquartile range, IQR]) increased significantly in the order of healthy control, PRISM, and COPD groups (5.0 [IQR, 3.0 to 9.0], 9.0 [IQR, 5.0 to 14.0], and 12.5 [IQR, 5.0 to 15.5], p=0.011; respectively). Similarly, the SGRQ scores also showed a significant increase from the healthy control to PRISM and COPD groups (19.9 [IQR, 6.1 to 30.7], 26.4 [IQR, 15.3 to 44.3], and 32.7 [IQR, 22.8 to 44.2], p=0.015; respectively).
In pulmonary function test, significant differences were observed among the healthy control, PRISM, and COPD groups, including FVC, FEV1, FEV1/FVC, FEF25%-75% (Table 1). Moreover, there were significant differences in serologic tests among the healthy control, PRISM, and COPD groups, including white blood cell (WBC) count, neutrophil count, neutrophil fraction, lymphocyte fraction, monocyte count, and monocyte fraction (Table 1).
Table 2 presents the mean and range of biomarker levels. No significant differences were observed in EBC biomarkers among the healthy, PRISM, and COPD groups (Table 2). The inflammatory biomarkers in EBC could not predict the results of sex, smoking status, and disease category.

2. Correlation between EBC biomarkers and demographic variables

In Table 3, we present biomarkers and clinical variables that exhibit a significant correlation greater than moderate (ρ>0.400) across the total, healthy control, and COPD groups. In the demographic variables, age exhibited weak negative correlations with TGF-β in the healthy group (ρ=-0.3458, p=0.0200). However, in COPD patients, TGF-β showed a strong positive correlation (ρ=0.9524 and p=0.0011), contrasting the results observed in healthy subjects (Figure 1A, B). Weight demonstrated a moderate negative correlation with TNF-α in COPD patients (ρ=-0.5604, p=0.0298) (Figure 1C, D). BMI exhibited a negative correlation with VEGF in COPD patients (ρ=-0.7094, p=0.0145) (Figure 1E, F).

3. Correlation between EBC biomarkers and symptomatic variables

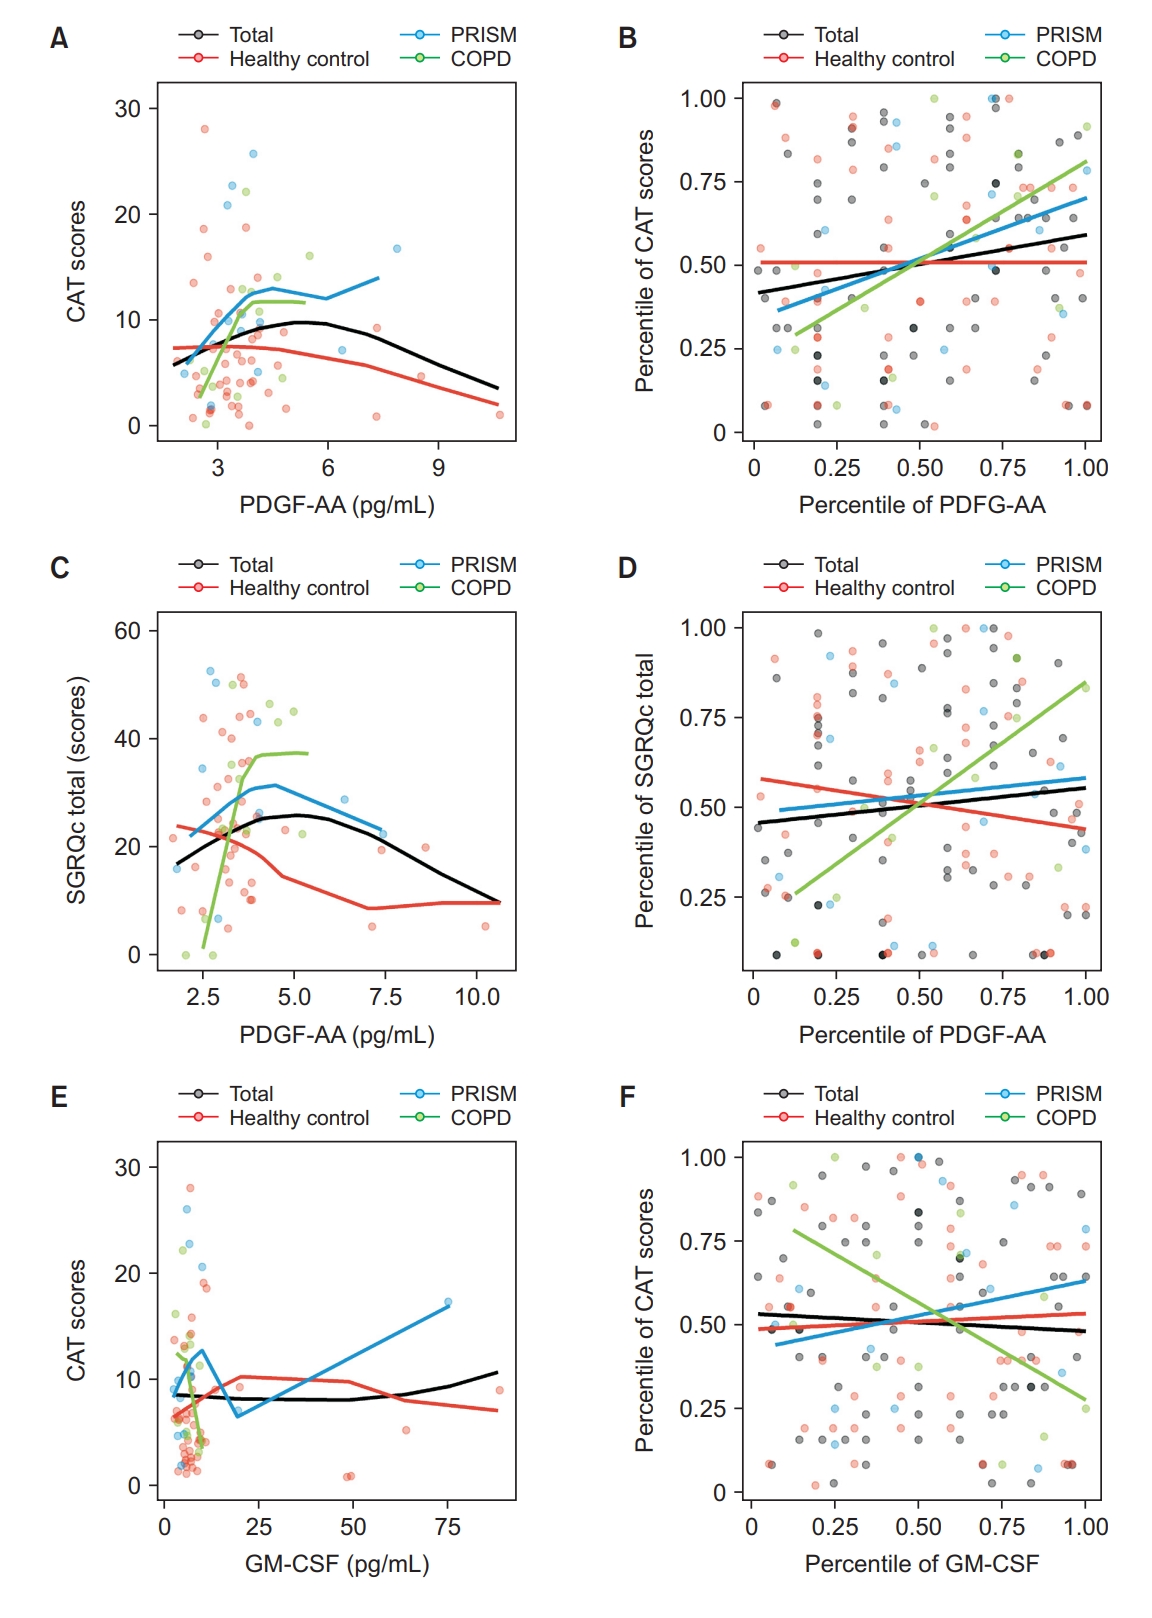
In symptomatic variables, PDGF-AA showed strong positive correlations with CAT (ρ=0.5926, p=0.0423) (Table 3 and Figure 2A, B) and SGRQ-C score (total, ρ=0.6725, p=0.0166; activity, ρ=0.7176, p=0.0086; and impacts, ρ=0.6151, p=0.0333) in COPD patients (Table 3 and Figure 2C, D). Granzyme B also exhibited strong positive correlations with SGRQ-C score (symptoms, ρ=0.6078, p=0.0360; and impacts, ρ=0.6007, p=0.0389) in COPD patients. IL-6 showed positive correlations with SGRQ score (activity) in PRISM patients (ρ=0.5144, p=0.0203) and COPD patients (ρ=0.4671, p=0.0378), but not in healthy individuals (ρ=0.0187, p=0.8690). GM-CSF exhibited a negative correlation with CAT score only in COPD patients (ρ=-0.5777, p=0.0491) (Figure 2E, F).

4. Correlation between EBC biomarkers and pulmonary function

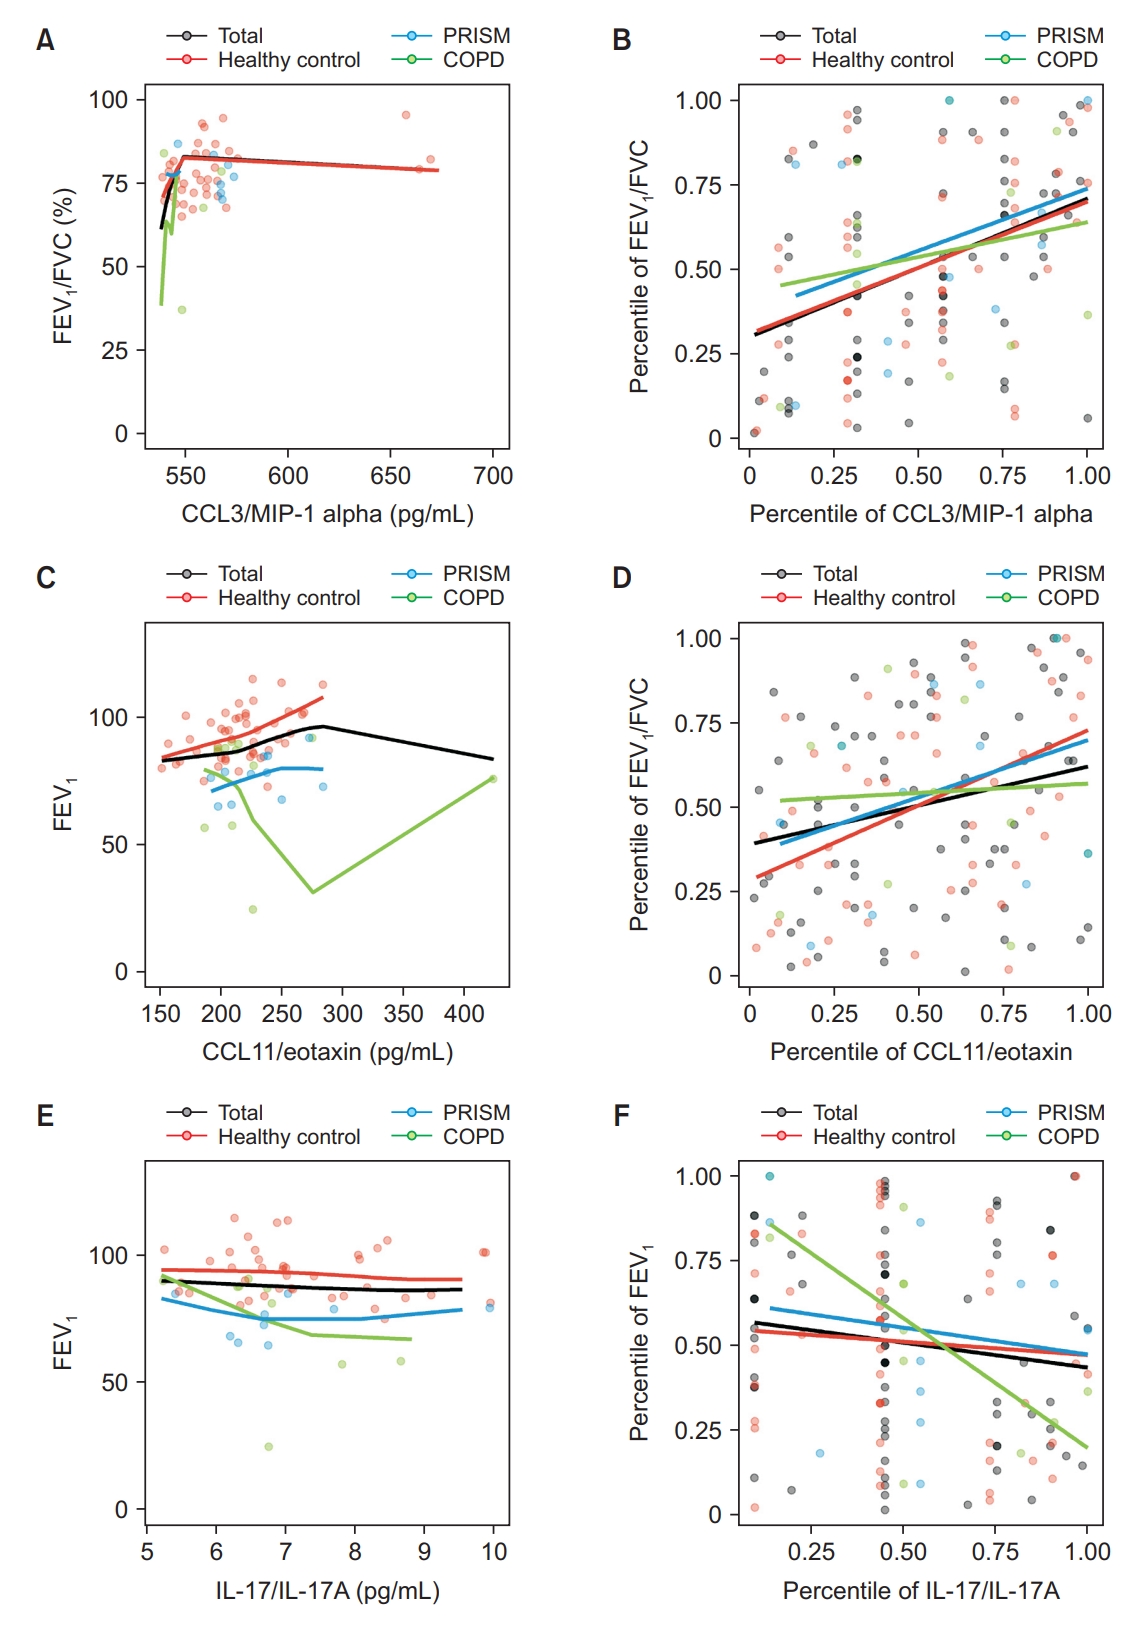
In the total subjects, the highest correlation was observed between predicted FEV1/FVC and CCL3/MIP-1 alpha (ρ=0.4061 and p<0.0001). While this positive correlation was present in healthy controls, it was not significant in COPD patients (ρ=0.3897, p=0.0068; and ρ=0.2010, p=0.5534, respectively) (Table 3 and Figure 3A, B). Among healthy subjects, the strongest correlation was found between predicted FEV1 and CCL11/eotaxin (ρ=0.4445, p=0.0017). However, no significant association was found in COPD patients and the total subjects (ρ=0.2305, p=0.0567; and ρ=0.0549, p=0.8726, respectively) (Figure 3C, D).
In COPD patients, FEV1/FVC and IL-8 showed strong positive correlation (ρ=0.6227, p=0.0174). However, this correlation was not significant in the total and healthy control groups (ρ=0.1395, p=0.1872; and ρ=0.0366, p=0.7704, respectively). Additionally, we observed a negative correlation between FEV1 and IL-17/IL-17A in COPD patients (ρ=-0.7024, p=0.0159) (Table 3 and Figure 3E, F).

5. Correlation between EBC biomarkers and WBC differential counts

In COPD patients, both WBC total count and serum neutrophil count showed significant negative correlations with IL-5 (ρ=-0.6659, p=0.0035; and ρ=-0.7080, p=0.0015, respectively) (Table 3 and Figure 4A, B). The serum eosinophil count showed a strong positive correlation with pro-collagen I alpha 1 (ρ=0.6735, p=0.0164) (Figure 4C, D) and MMP-12 (ρ=0.7004, p=0.0112) (Figure 4E, F). However, these correlations were not significant in healthy subjects (ρ=0.1850, p=0.2081; and ρ=-0.0504, p=0.7338; respectively).
Similarly, the absolute serum basophil count showed a strong positive correlation with pro-collagen I alpha 1 in COPD patients (ρ=0.6295, p=0.0283), but this correlation was not significant in healthy subjects (ρ=0.2166, p=0.1392). The serum hemoglobin exhibited a strong positive correlation with PDGF-AA in COPD patients (ρ=0.6056, p=0.0369). However, this correlation was not significant in healthy control subjects (ρ=-0.1989, p=0.1754).

6. Prediction value of exhaled breath condensate biomarkers for clinical parameters

In the ROC analysis for predicting airway obstruction pattern (FEV1/FVC <70 in pulmonary function test), only IL-8 demonstrated a significant predictive capability in the total subjects (AUC of ROC, 0.6762; 95% confidence interval, 0.5474 to 0.8050; p=0.0280). The optimal cutoff value for IL-8 was 11.5 pg/mL, with a sensitivity of 72.22% and a specificity of 61.64%. In the ROC analysis for predicting FEV1 <80% or FVC <80% of predicted, no significant biomarkers were found.

Discussion

In this pilot study, we explored the potential role of exhaled EBC across various spectrums of patients in respiratory clinical fields. The results demonstrated that several inflammatory biomarkers in EBC could be useful to predict quality of life concerning respiratory symptoms, serologic markers, and pulmonary functions. The relationships between biomarkers and clinical parameters exhibited diverse patterns across patient groups, indicating the complex nature of associations between biomarkers and clinical parameters. These findings highlight the imperative to develop personalized approaches for treatment and monitoring, customized to individual patient characteristics in the field of respiratory clinical care. As a pilot study, this research is suggesting possible clinical significance for several biomarkers.
The current study highlighted light on the potential role of PDGF-AA in COPD patients. PDGF is a major mitogen and chemotactic factor for mesenchymal cells [10]. It promotes the proliferation and migration of airway smooth muscle cells into the epithelium, as well as enhanced collagen synthesis by lung fibroblasts in asthma [11]. Therefore, PDGF and PDGF receptor (PDGFR) inhibitors have emerged as potential pharmacological targets for asthma. However, the role of PDGF in COPD remains poorly understood. Some animal experiments have reported the potential utility of PDGF in COPD [12,13]. In this study, PDGF-AA demonstrated a strong correlation with symptoms in both CAT and SGRQ-C among COPD patients, suggesting that PDGF could serve as a potential therapeutic target for COPD or a valuable biomarker for symptom monitoring and exacerbation prediction. However, further research is needed to validate these findings.
Pro-collagen I alpha 1 exhibited a notable correlation with eosinophils and basophils in individuals with COPD. Although evidence for related mechanisms is limited, Janulaityte et al. [14] demonstrated allergen-activated eosinophils induce collagen I and fibronectin gene expression in airway smooth muscle cells. Considering that basophil infiltration and eosinophil migration are integral components of allergic inflammation, proposing a correlation is reasonable [15]. However, the role of basophils and eosinophils in COPD remains not fully understood. Jogdand et al. [16] detected significant focal lung infiltrations of these cells in a noteworthy proportion of COPD patients. More recently, Winter et al. [17] reported associations between basophils and eosinophilic inflammation in COPD. Furthermore, researches are advancing for treating eosinophilic COPD by targeting eosinophils and basophils through the T2 inflammatory pathway, including the use of anti-IL-5 agents. In this context, pro-collagen I alpha 1 could serve as a potential monitoring or diagnostic tool for eosinophilic COPD patients. However, additional studies are necessary to substantiate these findings.
In this study, MMP-12 showed a correlation with eosinophil count in COPD patients. MMP-12 was shown to have an important function in the process of airway eosinophil accumulation in previous studies [18]. This suggests that MMP-12 could also be a potential eosinophil marker.
Conversely, in total and healthy individuals, these biomarkers can demonstrate different patterns or significance when compared to specific conditions such as COPD. These biomarkers usually play roles in vital biological pathways within the organisms, indicating that both deficiencies and excesses can be linked to disorders and abnormalities. As a result, correlations might not follow a simple linear or monotonic pattern due to the complex connections involved.
In healthy control, CCL11/eotaxin exhibited a moderate correlation with FEV1. Eotaxin serves as a potent eosinophil chemoattractant and is highly correlated with exacerbation and severity in asthma patients [19,20]. Furthermore, it is acknowledged to demonstrate an inverse relationship with FEV1 in asthma patients. However, the reported relationships in normal control and COPD patients are contradictory [20,21]. In the context of normal subjects, research on the association with FEV1 is notably limited. Coleman et al. [19] reported no significant association between FEV1 and eotaxin in a study involving 27 normal subjects. In contrast, Bradford et al. [21] identified a negative correlation between FEV1 and eotaxin in a larger cohort comprising both non-COPD (n=551) and COPD (n=566) individuals with a smoking history. In our study, we observed a positive correlation among healthy controls without COPD and PRISM. However, the overall subjects showed a regression with a non-monotonic concave curve.
The relationship between CCL3/MIP-1 alpha and FEV1/FVC in healthy controls is also not well established. In our study, positive correlations were observed among healthy controls and total subjects. However, a non-linear regression analysis indicated that both low and high levels of CCL3/MIP-1 alpha might be linked to FEV1/FVC impairment. Additional research is needed to understand and clarify these inconsistencies.
In this study, it was also suggested that IL-8 could be beneficial for diagnosing obstructive pattern lung diseases. The correlation between IL-8 and pulmonary function in healthy subjects remains unclear. In certain experimental studies, IL-8 has been noted to elevate airway contractility and correlate with hyperresponsiveness [22-24]. Notably, several studies have highlighted its usefulness in differentiating between asthma patients and those with asthma-COPD overlap syndrome [25-27].
EBC is collected from exhalated gas; however, biomarkers in EBC were significantly correlated with serologic markers. EBC has been examined in various respiratory diseases, including asthma [4], COPD [28], coronavirus disease 2019 (COVID-19) [29], and lung cancer [30]. Some biomarker in EBC have shown significant roles in other diseases, including helicobacter pylori infection [31], liver disease [32], kidney disease [33], and systemic vasculitis [34]. EBC could be used in research of various disease beyond respiratory diseases. Further studies will be needed to confirm the range of clinical fields in which EBC markers can be used.
This study has several limitations. First, this was a pilot study, and the sample size was small, especially in sub-group analyses. The pilot study outcomes will be pivotal in providing the effect size, allowing us to determine statistically significant sample sizes for individual patient subgroups and variables. Second, we did not collect sputum eosinophil count, which could be more reliable to reflect airway status than serum eosinophil. Third, we could not establish long-term clinical significance of EBC. Lastly, this study sample included many healthy control subjects. COPD and PRISM subjects were not recruited sufficiently so that a statistically significance was not proven. The mean of lung function was within the normal range, and the range of value was quite narrow. This could have led to insignificance of the correlation between some EBC and clinical parameters. Therefore, we could not suggest specific clinical applications.
We conducted a pilot study to reveal the roles of EBC in the clinical field. Several inflammatory biomarkers in EBC could be useful to predict quality of life concerning respiratory symptoms and serologic markers. Further studies are needed to confirm the usefulness of them in various respiratory clinical fields.

Notes

Authors’ Contributions

Conceptualization: Park HJ. Methodology: Choi YJ, Byun MK, Park HJ. Formal analysis: Choi YJ, Park S. Data curation: Choi YJ, Lee MJ, Park S. Software: Choi YJ. Park S. Validation: Byun MK, Park HJ. Investigation: Park J, Park D, Kim SH, Kim Y, Lim SY, Yoo KH, Jung KS, Park HJ. Writing - original draft preparation: Choi YJ, Lee MJ. Writing - review and editing: Park HJ. Approval of final manuscript: all authors.

Conflicts of Interest

No potential conflict of interest relevant to this article was reported.

Funding

This research was supported by a fund from the research program of the Korea Medical Institute. In addition, this work was supported by the Research Program funded Korea National Institute of Health (Fund CODE 2016ER670100, 2016ER670101, 2016ER670102, 2018 ER67100, 2018ER67101, 2018ER67102, 2021ER120500, and 2021ER120501).

Fig. 1.
Correlation between exhaled breath condensate biomarkers and demographic variables. (A) Local regression analysis between age and transforming growth factor β (TGF-β). (B) Spearman correlation between age and TGF-β. (C) Local regression analysis between body weight and tumor necrosis factor α (TNF-α). (D) Spearman correlation between body weight and TNF-α. (E) Local regression analysis between body mass index and vascular endothelial growth factor (VEGF). (F) Spearman correlation between body mass index and VEGF. PRISM: preserved ratio impaired spirometry; COPD: chronic obstructive pulmonary disease.
trd-2023-0028f1.jpg
Fig. 2.
Correlation between exhaled breath condensate biomarkers and symptomatic variables. (A) Local regression analysis between chronic obstructive pulmonary disease (COPD) assessment test (CAT) score and platelet derived growth factor (PDGF)-AA. (B) Spearman correlation between CAT score and PDGF-AA. (C) Local regression analysis between COPD-specific version of St. George’s Respiratory Questionnaire (SGRQ-C) and PDGF-AA. (D) Spearman correlation between SGRQ-C and PDGF-AA. (E) Local regression analysis between CAT score and granulocyte-macrophage colony-stimulating factor (GM-CSF). (F) Spearman correlation between CAT score and GM-CSF. PRISM: preserved ratio impaired spirometry; COPD: chronic obstructive pulmonary disease.
trd-2023-0028f2.jpg
Fig. 3.
Correlation between exhaled breath condensate biomarkers and pulmonary functions. (A) Local regression analysis between forced expiratory volume in 1 second (FEV1)/forced vital capacity (FVC) (%) and CC chemokine ligand 3 (CCL3)/macrophage inflammatory protein 1 (MIP-1) alpha. (B) Spearman correlation between FEV1/FVC (%) and CCL3/MIP-1 alpha. (C) Local regression analysis between FEV1 and CCL11/eotaxin. (D) Spearman correlation between FEV1 and CCL11/eotaxin. (E) Local regression analysis between FEV1 and interleukin 17 (IL-17)/IL-17A. (F) Spearman correlation between FEV1 and IL-17/IL-17A. PRISM: preserved ratio impaired spirometry; COPD: chronic obstructive pulmonary disease.
trd-2023-0028f3.jpg
Fig. 4.
Correlation between exhaled breath condensate biomarkers and demographic white blood cell differential counts. (A) Local regression analysis between serum neutrophil count and interleukin 5 (IL-5). (B) Spearman correlation between serum neutrophil count and IL-5. (C) Local regression analysis between serum eosinophil count and pro-collagen I alpha 1. (D) Spearman correlation between serum eosinophil count and pro-collagen I alpha 1. (E) Local regression analysis between serum eosinophil count and matrix metalloproteinase 12 (MMP-12). (F) Spearman correlation between eosinophil count and MMP-12. PRISM: preserved ratio impaired spirometry; COPD: chronic obstructive pulmonary disease.
trd-2023-0028f4.jpg
Table 1.
Characteristics of enrolled subjects
Characteristic Total (n=123) Healthy control (n=81) PRISM (n=21) COPD (n=21) p-value
Age, yr 61.0 (52.0-67.0) 62.0 (52.0-67.0) 60.0 (58.0-67.0) 61.0 (52.0-69.0) 0.956
Male sex 94 (76.4) 62 (76.5) 16 (76.2) 16 (76.2) 0.999
Weight, kg 65.9±12.2 65.3±12.0 67.1±12.0 67.5±13.4 0.708
Height, cm 166.2±8.1 166.1±8.1 167.9±9.4 165.4±6.9 0.607
Body mass index, kg/m2 23.8±3.5 23.6±3.3 23.8±3.8 24.6±4.1 0.545
Smoking history 0.895
 Never smoker 31 (25.4) 21 (25.9) 6 (30.0) 4 (19.0)
 Former smoker 52 (42.6) 34 (42.0) 9 (45.0) 9 (42.9)
 Current smoker 39 (32.0) 26 (32.1) 5 (25.0) 8 (38.1)
Symptoms (n=120)
 CAT score 6.0 (4.0-11.0) 5.0 (3.0-9.0) 9.0 (5.0-14.0) 12.5 (5.0-15.5) 0.011*
 SGRQ score (total) 23.2 (8.3-35.6) 19.9 (6.1-30.7) 26.4 (15.3-44.3) 32.7 (22.8-44.2) 0.015*
  Symptoms 8.9 (3.4-16.9) 5.4 (2.8-12.6) 13.4 (6.6-26.4) 13.2 (9.0-20.2) 0.002*
  Activity 2.3 (0.0-9.6) 2.1 (0.0-5.5) 5.9 (2.1-17.1) 5.9 (2.1-13.7) 0.020*
  Impacts 7.6 (0.0-15.3) 3.6 (0.0-14.9) 14.9 (7.4-33.2) 14.9 (7.4-23.1) 0.002*
Pulmonary function test (n=117)
 FVC, L 3.7 (3.2-4.2) 3.8 (3.3-4.4) 3.2 (2.7- 3.5) 3.8 (3.2-4.3) 0.005*
  Predicted FVC, % 87.0 (81.0-97.0) 89.0 (82.5-97.5) 71.0 (67.0-81.0) 88.0 (84.5-99.5) <0.001*
 FEV1, L 2.8±0.7 3.0±0.7 2.4±0.5 2.2±0.7 <0.001*
  Predicted FEV1, % 3.2±0.6 94.0 (84.5-102.0) 81.0 (57.5-88.0) 78.5 (67.0-79.5) <0.001*
 FEV1/FVC, % 76.0 (71.0-82.0) 77.0 (72.0-82.5) 75.5 (72.0-83.5) 61.0 (46.0-67.5) <0.001*
 FEF25%-75%, L/sec 2.1 (1.4-3.1) 2.4 (1.9- 3.3) 1.8 (1.4- 2.6) 0.8 (0.6-1.3) <0.001*
  Predicted FEF25%-75%, % 80.5 (58.0-104.0) 94.0 (71.5-107.0) 68.5 (55.5-86.0) 36.0 (20.0-53.0) <0.001*
Serologic test (n=123)
 White blood cell, 103/μL 5.8 (4.8-6.9) 5.4 (4.5-6.5) 6.6 (5.4-8.2) 6.5 (5.5-7.8) 0.001*
 Neutrophil, 103/μL 3.3 (2.5-4.1) 3.0 (2.2-3.5) 4.3 (3.4-4.9) 3.9 (2.9-4.3) <0.001*
 Neutrophil fraction, % 56.7±10.2 54.4±9.7 64.2±9.8 58.3±8.6 <0.001*
 Lymphocyte, 103/μL 1.8 (1.4-2.3) 1.8 (1.4-2.3) 1.6 (1.3-2.0) 2.0 (1.6-2.5) 0.118
 Lymphocyte fraction, % 31.9±9.3 34.0±9.2 25.8±8.3 30.0±8.0 0.001*
 Monocyte, 103/μL 0.5±0.2 0.5±0.1 0.4±0.2 0.6±0.2 0.004*
 Monocyte fraction, % 7.9±2.2 8.2±2.1 6.7±2.5 8.2±2.0 0.021*
 Eosinophil, 103/μL 0.1 (0.1-0.2) 0.1 (0.1-0.2) 0.2 (0.1-0.2) 0.2 (0.1-0.2) 0.062
 Eosinophil fraction, % 2.1 (1.4-3.6) 2.1 (1.4-3.6) 2.1 (1.5-3.6) 2.1 (1.6-3.6) 0.883
 Basophil, 103/μL 0.0 (0.0-0.0) 0.0 (0.0-0.0) 0.0 (0.0-0.0) 0.0 (0.0-0.1) 0.550
 Basophil fraction, % 0.6 (0.4-0.8) 0.7 (0.5-0.8) 0.5 (0.4-0.7) 0.7 (0.4-0.9) 0.168
 Red blood cell, 106/μL 4.5±0.5 4.5±0.5 4.5±0.6 4.6±0.4 0.625
 Hemoglobin, g/dL 13.9±1.6 13.9±1.6 13.5±1.6 14.1±1.3 0.366
 Platelet, 103/μL 235.0 (197.0-274.0) 234.5 (195.5-271.0) 232.0 (197.0-269.0) 256.0 (212.0-321.0) 0.356

Values are presented as median (interquartile range), number (%), or mean±standard deviation.

* p-value less than 0.05.

PRISM: preserved ratio impaired spirometry; COPD: chronic obstructive pulmonary disease; CAT: COPD assessment test; SGRQ: St. George’s respiratory questionnaire; FVC: forced vital capacity; FEV1: forced expiratory volume in 1 second; FEF25%-75%: forced expiratory flow from 25% to 75%.

Table 2.
Variable markers in exhaled condensates
Variable Healthy control PRISM COPD p-value Minimum Maximum Mean±SD
Conventional ELISA
 IL-6 (n=123) 1.0 (0.2-1.8) 1.4 (0.6-2.2) 1.0 (0.4-2.2) 0.415 0.0 6.0 1.33±1.18
 IL-5 (n=106) 0.3 (0.2-0.5) 0.3 (0.1-0.7) 0.2 (0.2-0.3) 0.204 0.0 2.38 0.37±0.36
 TNF-α (n=104) 3.2 (2.4-3.7) 3.6 (2.6-4.4) 2.9 (2.8-3.8) 0.369 0.65 9.12 3.29±1.35
 IL-8 (n=99) 12.0 (11.0-12.0) 12.0 (11.5-12.0) 11.5 (11.0-12.0) 0.596 5.00 22.00 11.98±2.11
 TGF-β (n=66) 6.6 (5.6-7.6) 6.9 (5.0-8.3) 7.0 (3.8-7.7) 0.928 2.26 16.61 6.70±2.39
 IL-1β (n=56) 2.2 (1.7-2.6) 1.9 (1.2-2.6) 1.9 (1.3-2.4) 0.768 0.24 6.27 2.13±1.06
Multiplex ELISA (n=74)
 Chitinase 3-like 1 1,216.0 (1,216.0-1,246.3) 1,246.3 (1,216.0-1,246.3) 1,216.0 (1,200.8-1,246.3) 0.474 1,170.43 2,075.1 1,253.12±119.9
 CCL3/MIP-1 alpha 544.0 (542.3-545.8) 545.8 (544.0-547.5) 542.3 (540.6-543.2) 0.496 538.06 897.29 555.66±50.38
 CCL11/Eotaxin 214.2 (198.3-234.6) 229.4 (208.4-237.4) 212.8 (205.6-240.3) 0.489 150.46 424.33 221.17±37.74
 CXCL2/GRO-β/MIP-2/CINC-3 169.7 (167.9-173.3) 170.6 (167.9-175.1) 171.5 (168.8-173.3) 0.842 164.24 285.56 174.84±16.92
 MMP-12 166.1 (165.7-166.7) 166.4 (165.4-167.3) 166.1 (165.4-166.7) 0.698 164.12 275.41 169.81±15.60
 Pro-collagen I alpha 1 13.2 (11.5-15.5) 13.2 (10.9-14.4) 13.2 (13.2-15.5) 0.560 8.64 25.85 13.53±2.59
 IL-33 12.9 (11.6-13.9) 12.8 (10.8-13.9) 12.9 (12.4-13.9) 0.565 9.71 19.26 12.98±1.94
 GM-CSF 6.9 (5.7-9.5) 6.1 (4.2-9.7) 6.5 (5.4-9.1) 0.518 2.45 88.86 11.04±15.62
 VEGF 7.2 (6.8-8.1) 7.9 (6.8-8.1) 7.2 (5.9-8.8) 0.818 4.91 11.39 7.55±1.40
 IL-17/IL-17A 6.6 (6.6-8.1) 6.6 (6.6-8.1) 6.6 (6.6-7.4) 0.944 5.20 13.90 7.22±1.66
 PDGF-AA 3.4 (3.0-3.9) 3.5 (2.9-3.9) 3.6 (3.0-4.1) 0.859 1.77 10.65 3.78±1.46
 TSLP 1.4 (1.3-1.6) 1.6 (1.4-1.8) 1.4 (1.3-1.5) 0.261 0.97 2.84 1.51±0.32

Values are presented as median (interquartile range).

PRISM: preserved ratio impaired spirometry; COPD: chronic obstructive pulmonary disease; SD: standard deviation; ELISA: enzyme-linked immunosorbent assay; IL: interleukin; TNF-α: tumor necrosis factor α; TGF-β: transforming growth factor β; CCL: CC chemokine ligand; MIP: macrophage inflammatory protein; CXCL: CXC chemokine ligand; GRO: growth-regulated protein; CINC: cytokine-induced neutrophil chemoattractant; MMP: matrix metalloproteinase; GM-CSF: granulocyte-macrophage colony-stimulating factor; VEGF: vascular endothelial growth factor; PDGF: platelet derived growth factor; TSLP: thymic stromal lymphopoietin.

Table 3.
Biomarkers and clinical variables with significant correlations above moderate
Variable Biomarkers Total
Healthy
COPD
ρ p-value ρ p-value ρ p-value
Demographic variables
 Age, yr TGF-β -0.0834 0.5055 -0.3458 0.0200* 0.9524*, 0.0011*,
 Weight, kg TNF-α -0.0276 0.7873 0.0497 0.6829 -0.5604 0.0298*,
 BMI, kg/m2 VEGF -0.2285 0.0553 0.0394 0.7904 -0.7094 0.0145*,
Symptomatic variables
 CAT score PDGF-AA 0.1757 0.1371 -0.0003 0.9986 0.5926*, 0.0423*,
GM-CSF -0.0522 0.6608 0.0476 0.7506 -0.5777 0.0491*,
 SGRQ score (total) PDGF-AA 0.0987 0.4095 -0.1429 0.3378 0.6725*, 0.0166*,
  Symptoms Granzyme B 0.1583 0.1843 0.0176 0.9067 0.6078*, 0.0360*,
  Activity PDGF-AA -0.0792 0.5082 -0.3051 0.0371* 0.7176*, 0.0086*,
IL-6 0.1985 0.0298* 0.0187 0.8690 0.4671*, 0.0378*,
  Impacts PDGF-AA 0.0148 0.9020 -0.1663 0.2640 0.6151*, 0.0333*,
Granzyme B 0.1562 0.1902 0.0120 0.9360 0.6007*, 0.0389*,
Pulmonary function test
 Predicted FEV1, % CCL11/eotaxin 0.2305 0.0567 0.4445*, 0.0017*, 0.0549 0.8726
IL-17/IL-17A -0.1409 0.2481 -0.0765 0.6095 -0.7024*, 0.0159*,
 FEV1/FVC, % IL-8 0.1395 0.1872 0.0366 0.7704 0.6227*, 0.0174*,
CCL3/MIP-1 alpha 0.4061*, 0.0005*, 0.3897 0.0068* 0.2010 0.5534
White blood cell differential count
 White blood cell, 103/μL IL-5 -0.0919 0.3486 -0.0365 0.7606 -0.6659*, 0.0035*,
 Neutrophil, 103/μL IL-5 -0.0955 0.3303 0.0122 0.9187 -0.7080*, 0.0015*,
 Eosinophil, 103/μL Pro-collagen I alpha 1 0.1030 0.3825 0.1850 0.2081 0.6735*, 0.0164*,
MMP-12 0.2173 0.0629 -0.0504 0.7338 0.7004*, 0.0112*,
 Basophil, 103/μL Pro-collagen I alpha 1 0.2151 0.0657 0.2166 0.1392 0.6295*, 0.0283*,
 Hemoglobin, g/dL PDGF-AA -0.0428 0.7176 -0.1989 0.1754 0.6056*, 0.0369*,

* p<0.05 or |ρ|>0.4.

Values represent correlations with equal to or greater than moderate significance.

COPD: chronic obstructive pulmonary disease; TGF-β: transforming growth factor β; TNF-α: tumor necrosis factor α; BMI: body mass index; VEGF: vascular endothelial growth factor; CAT: COPD assessment test; PDGF: platelet derived growth factor; GM-CSF: granulocyte-macrophage colony-stimulating factor; SGRQ: St. George’s respiratory questionnaire; IL: interleukin; FEV1: forced expiratory volume in 1 second; CCL: CC chemokine ligand; MIP: macrophage inflammatory protein; FVC: forced vital capacity; MMP: matrix metalloproteinase.

References

1. Polomska J, Bar K, Sozanska B. Exhaled breath condensate: a non-invasive approach for diagnostic methods in asthma. J Clin Med 2021;10:2697.
crossref pmid pmc
2. Gessner C, Scheibe R, Wotzel M, Hammerschmidt S, Kuhn H, Engelmann L, et al. Exhaled breath condensate cytokine patterns in chronic obstructive pulmonary disease. Respir Med 2005;99:1229-40.
crossref pmid
3. Jaskiewicz K, Mycroft K, Maskey-Warzechowska M, Paralusz K, Siemiez N, Nejman-Gryz P, et al. Exhaled biomarkers in idiopathic pulmonary fibrosis: a six-month follow-up study in patients treated with pirfenidone. J Clin Med 2020;9:2523.
crossref pmid pmc
4. Kostikas K, Koutsokera A, Papiris S, Gourgoulianis KI, Loukides S. Exhaled breath condensate in patients with asthma: implications for application in clinical practice. Clin Exp Allergy 2008;38:557-65.
crossref pmid
5. Lee JY, Chon GR, Rhee CK, Kim DK, Yoon HK, Lee JH, et al. Characteristics of patients with chronic obstructive pulmonary disease at the first visit to a pulmonary medical center in Korea: the Korea COPD Subgroup Study Team Cohort. J Korean Med Sci 2016;31:553-60.
crossref pmid pmc pdf
6. Sin DD. The importance of early chronic obstructive pulmonary disease: a lecture from 2022 Asian Pacific Society of Respirology. Tuberc Respir Dis (Seoul) 2023;86:71-81.
crossref pmid pmc pdf
7. Park HJ, Byun MK, Rhee CK, Kim K, Kim HJ, Yoo KH. Significant predictors of medically diagnosed chronic obstructive pulmonary disease in patients with preserved ratio impaired spirometry: a 3-year cohort study. Respir Res 2018;19:185.
crossref pmid pmc pdf
8. Akoglu H. User’s guide to correlation coefficients. Turk J Emerg Med 2018;18:91-3.
crossref pmid pmc
9. Prion S, Haerling KA. Making sense of methods and measurement: Spearman-rho ranked-order correlation coefficient. Clin Simul Nurs 2014;10:535-6.
crossref
10. Sulzbacher I, Traxler M, Mosberger I, Lang S, Chott A. Platelet-derived growth factor-AA and -alpha receptor expression suggests an autocrine and/or paracrine loop in osteosarcoma. Mod Pathol 2000;13:632-7.
pmid
11. Kardas G, Daszynska-Kardas A, Marynowski M, Brząkalska O, Kuna P, Panek M. Role of platelet-derived growth factor (PDGF) in asthma as an immunoregulatory factor mediating airway remodeling and possible pharmacological target. Front Pharmacol 2020;11:47.
crossref pmid pmc
12. Su Y. Airway smooth muscle malfunction in COPD. In: Wang YX, editors. Calcium signaling in airway smooth muscle cells. Cham: Springer International Publishing; 2014. p. 441-57.

13. Churg A, Tai H, Coulthard T, Wang R, Wright JL. Cigarette smoke drives small airway remodeling by induction of growth factors in the airway wall. Am J Respir Crit Care Med 2006;174:1327-34.
crossref pmid
14. Janulaityte I, Januskevicius A, Kalinauskaite-Zukauske V, Bajoriuniene I, Malakauskas K. In vivo allergen-activated eosinophils promote collagen I and fibronectin gene expression in airway smooth muscle cells via TGF-β1 signaling pathway in asthma. Int J Mol Sci 2020;21:1837.
crossref pmid pmc
15. Iype J, Fux M. Basophils orchestrating eosinophils’ chemotaxis and function in allergic inflammation. Cells 2021;10:895.
crossref pmid pmc
16. Jogdand P, Mori M, Bergqvist A, Walls A, Sanden C, Erjefalt J. Mapping of eosinophil and basophils in COPD lung tissues. Eur Respir J 2015;46(suppl 59):PA384.
crossref
17. Winter NA, Gibson PG, McDonald VM, Fricker M. Sputum gene expression reveals dysregulation of mast cells and basophils in eosinophilic COPD. Int J Chron Obstruct Pulmon Dis 2021;16:2165-79.
crossref pmid pmc pdf
18. Pouladi MA, Robbins CS, Swirski FK, Cundall M, McKenzie AN, Jordana M, et al. Interleukin-13-dependent expression of matrix metalloproteinase-12 is required for the development of airway eosinophilia in mice. Am J Respir Cell Mol Biol 2004;30:84-90.
crossref pmid
19. Coleman JM, Naik C, Holguin F, Ray A, Ray P, Trudeau JB, et al. Epithelial eotaxin-2 and eotaxin-3 expression: relation to asthma severity, luminal eosinophilia and age at onset. Thorax 2012;67:1061-6.
crossref pmid pmc
20. Elassal G, Mamdouh R. Assessment of eotaxin 1 in exhaled breath condensate of chronic obstructive pulmonary disease patients. Egypt J Chest Dis Tuberc 2014;63:67-71.
crossref
21. Bradford E, Jacobson S, Varasteh J, Comellas AP, Woodruff P, O’Neal W, et al. The value of blood cytokines and chemokines in assessing COPD. Respir Res 2017;18:180.
crossref pmid pmc pdf
22. Govindaraju V, Michoud MC, Ferraro P, Arkinson J, Safka K, Valderrama-Carvajal H, et al. The effects of interleukin-8 on airway smooth muscle contraction in cystic fibrosis. Respir Res 2008;9:76.
crossref pmid pmc pdf
23. Qazi BS, Tang K, Qazi A. Recent advances in underlying pathologies provide insight into interleukin-8 expression-mediated inflammation and angiogenesis. Int J Inflam 2011;2011:908468.
crossref pmid pmc pdf
24. Che L, Yu C, Chen G, Lin J, Xie Z, Xia T, et al. The inflammatory response induced by RELMβ upregulates IL-8 and IL-1β expression in bronchial epithelial cells in COPD. Int J Chron Obstruct Pulmon Dis 2021;16:2503-13.
crossref pmid pmc pdf
25. Hosoki K, Ying S, Corrigan C, Qi H, Kurosky A, Jennings K, et al. Analysis of a panel of 48 cytokines in BAL fluids specifically identifies IL-8 levels as the only cytokine that distinguishes controlled asthma from uncontrolled asthma, and correlates inversely with FEV1. PLoS One 2015;10:e0126035.
crossref pmid pmc
26. Huang AX, Lu LW, Liu WJ, Huang M. Plasma inflammatory cytokine IL-4, IL-8, IL-10, and TNF-α levels correlate with pulmonary function in patients with asthma-chronic obstructive pulmonary disease (COPD) overlap syndrome. Med Sci Monit 2016;22:2800-8.
crossref pmid pmc
27. Ding Q, Sun S, Zhang Y, Tang P, Lv C, Ma H, et al. Serum IL-8 and VEGFA are two promising diagnostic biomarkers of asthma-COPD overlap syndrome. Int J Chron Obstruct Pulmon Dis 2020;15:357-65.
pmid pmc
28. Kazeminasab S, Emamalizadeh B, Jouyban A, Shoja MM, Khoubnasabjafari M. Macromolecular biomarkers of chronic obstructive pulmonary disease in exhaled breath condensate. Biomark Med 2020;14:1047-63.
crossref pmid
29. Ryan DJ, Toomey S, Madden SF, Casey M, Breathnach OS, Morris PG, et al. Use of exhaled breath condensate (EBC) in the diagnosis of SARS-COV-2 (COVID-19). Thorax 2021;76:86-8.
crossref pmid
30. Campanella A, De Summa S, Tommasi S. Exhaled breath condensate biomarkers for lung cancer. J Breath Res 2019;13:044002.
crossref pmid pdf
31. Yildirim Z, Bozkurt B, Ozol D, Armutcu F, Akgedik R, Karamanli H, et al. Increased exhaled 8-isoprostane and interleukin-6 in patients with Helicobacter pylori infection. Helicobacter 2016;21:389-94.
crossref pmid
32. Jing J, Sang XX, You SL, Zhu B, Cui YF, Li CY, et al. Metabolomic profiles of breath odor compounds for prognostic prediction in patients with acute-on-chronic liver failure: a pilot study. Hepatol Res 2021;51:490-502.
crossref pmid pdf
33. Tiryaki BS, Tasliyurt T, Yelken BM, Sahin S, Kutluturk F, Koseoglu HI, et al. Evaluation of oxidative stress using exhaled breath 8-isoprostane levels on chronic kidney disease. Niger J Clin Pract 2014;17:356-60.
crossref pmid
34. Szczeklik W, Sanak M, Mastalerz L, Sokolowska BM, Gielicz A, Soja J, et al. 12-Hydroxy-eicosatetraenoic acid (12-HETE): a biomarker of Churg-Strauss syndrome. Clin Exp Allergy 2012;42:513-22.
crossref pmid
TOOLS
METRICS Graph View
  • 0 Crossref
  • 0 Scopus
  • 1,555 View
  • 206 Download
ORCID iDs

Yong Jun Choi
https://orcid.org/0000-0002-6114-2059

Min Jae Lee
https://orcid.org/0009-0002-7480-4071

Hye Jung Park
https://orcid.org/0000-0002-1862-1003

Funding Information

Korea Medical Institute

Korea National Institute of Health
https://doi.org/10.13039/501100003653
2016ER670100
2016ER670101
2016ER670102
2018 ER67100
2018ER67101
2018ER67102
2021ER120500
2021ER120501

Related articles

Two Cases of Inflammatory Pseudotumor in Respiratory System.1999 March;46(3)


ABOUT
ARTICLE & TOPICS
Article category

Browse all articles >

Topics

Browse all articles >

BROWSE ARTICLES
FOR CONTRIBUTORS
Editorial Office
101-605, 58, Banpo-daero, Seocho-gu (Seocho-dong, Seocho Art-Xi), Seoul 06652, Korea
Tel: +82-2-575-3825, +82-2-576-5347    Fax: +82-2-572-6683    E-mail: katrdsubmit@lungkorea.org                

Copyright © 2024 by The Korean Academy of Tuberculosis and Respiratory Diseases. All rights reserved.

Developed in M2PI

Close layer
prev next