Tuberc Respir Dis > Epub ahead of print
Seok and Yoon: Association between the Risk of Obstructive Sleep Apnea and Lung Function: Korea National Health and Nutrition Examination Survey

Abstract

Background

Obstructive sleep apnea (OSA) is a prevalent sleep disorder associated with various health issues. Although some studies have suggested an association between reduced lung function and OSA, this association remains unclear. Our study aimed to explore this relationship using data from a nationally representative population- based survey.

Methods

We performed an analysis of data from the 2019 Korea National Health and Nutrition Examination Survey. Our study encompassed 3,675 participants aged 40 years and older. Risk of OSA was assessed using the STOP-Bang (Snoring, Tiredness during daytime, Observed apnea, and high blood Pressure-Body mass index, Age, Neck circumference, Gender) questionnaire and lung function tests were performed using a portable spirometer. Logistic regression analysis was applied to identify the risk factors associated with a high-risk of OSA, defined as a STOP-Bang score of ≥3.

Results

Of 3,675 participants, 600 (16.3%) were classified into high-risk OSA group. Participants in the high-risk OSA group were older, had a higher body mass index, and a higher proportion of males and ever-smokers. They also reported lower lung function and quality of life index in various domains along with increased respiratory symptoms. Univariate logistic regression analysis indicated a significant association between impaired lung function and a high-risk of OSA. However, in the multivariable analysis, only chronic cough (odds ratio [OR], 2.413; 95% confidence interval [CI], 1.383 to 4.213) and sputum production (OR, 1.868; 95% CI, 1.166 to 2.992) remained significantly associated with a high OSA risk.

Conclusion

Our study suggested that, rather than baseline lung function, chronic cough, and sputum production are more significantly associated with OSA risk.

Introduction

Obstructive sleep apnea (OSA) is a sleep disorder characterized by recurrent blockage of the upper airway during sleep, leading to reduced oxygen levels, interruptions in sleep, and diminished sleep quality [1,2]. OSA is a prevalent sleep disorder affecting a substantial portion of the global population, with an estimated worldwide prevalence of approximately 45%, which can vary based on the geographical location and diagnostic methods employed [3-5]. Risk factors associated with OSA include advancing age, male sex, obesity, excessive daytime sleepiness, and structural abnormalities in the craniofacial and upper airway regions. Moreover, OSA frequently co-occurs with various health conditions, including cardiovascular and cerebrovascular diseases, metabolic disorders, renal diseases, and chronic respiratory disease [6]. Chronic obstructive pulmonary disease (COPD) is a collective term for a group of respiratory diseases characterized by persistent, not fully reversible airflow obstruction. It often co-occurs with OSA, a condition referred to as the overlap syndrome. The prevalence of this overlap syndrome ranges from 3% to 66% among patients with COPD and affects 8% to 56% of individuals with OSA [7]. Asthma, a condition marked by reversible airflow limitation, heightened airway responsiveness, and airway inflammation, is also frequently found alongside OSA [8].
Studies have reported an association between reduced lung function and OSA. Patients with OSA often exhibit decreased lung volume, diminished functional residual capacity, and decreased residual volume owing to reduced lung and chest wall compliance [9,10]. Moreover, OSA prevalence increases with age [3]. Consequently, it is often associated with an overall decline in lung function, including reductions in forced expiratory volume per 1 second (FEV1) and forced vital capacity (FVC) [11,12]. Other studies have found that low lung function is more closely related to obesity than to OSA [13], as OSA is not independently associated with baseline lung function but is rather associated with a rapid decline in lung function [14-16]. Therefore, our study aimed to comprehensively investigate the association between OSA risk and lung function using data from a large-scale, nationally representative population-based study.

Materials and Methods

1. Study design and participants

The Korea National Health and Nutrition Examination Survey (KNHANES) is an extensive nationwide survey conducted annually by the Korea Disease Control and Prevention Agency (KDCA) since 1988 [17,18]. This comprehensive cross-sectional survey is designed to assess various aspects of the health status, health behaviors, and dietary habits of the Korean population. It comprises three main components, including health interviews, health examinations, and nutrition surveys, and typically involves a sample size of approximately 10,000 individuals each year. The data collected in the KNHANES cover various factors, including socioeconomic status, health-related behaviors, quality of life, healthcare utilization, anthropometric measurements, biochemical and clinical profiles related to noncommunicable diseases, and dietary intake patterns.
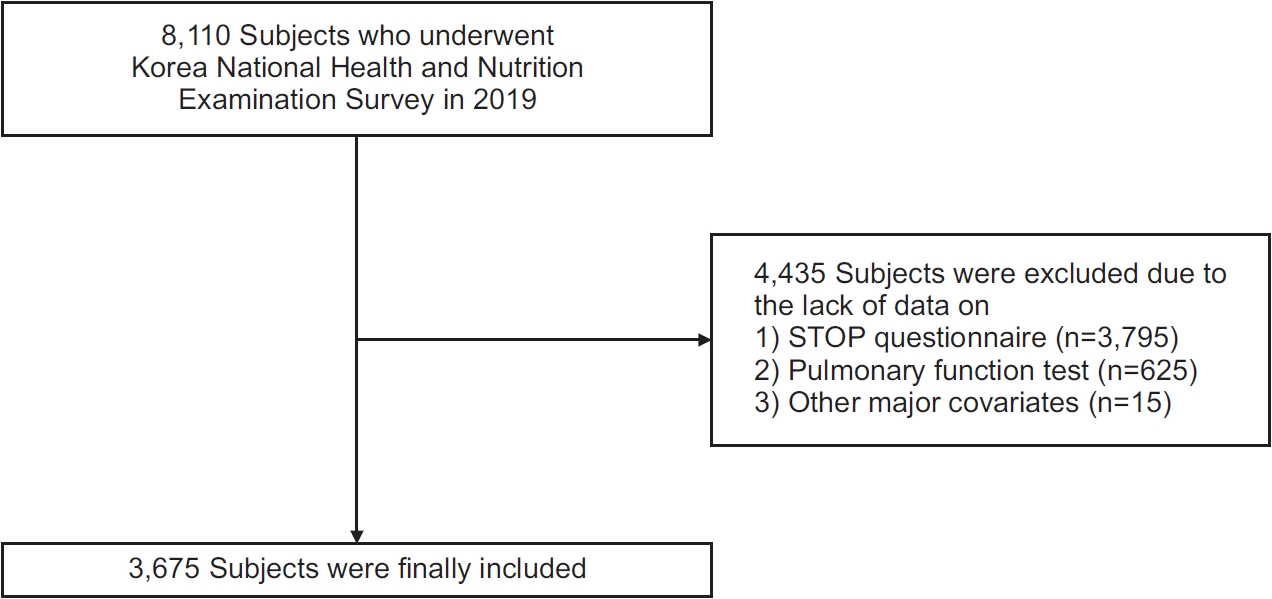
Starting in 2019, KNHANES introduced the collection of data using the STOP (Snoring, Tiredness during daytime, Observed apnea, and high blood Pressure) questionnaire, which serves as a straightforward and reliable tool for identifying individuals at high-risk for OSA [19]. This questionnaire was administered to adults aged 40 years and older. We screened 8,110 participants from the 2019 KNHANES. Of the participants, 4,435 were excluded due to unavailable data on the STOP questionnaire (n=3,795), lung function (n=625), and other major covariates (n=15). Finally, 3,675 participants were included in the analysis (Figure 1). This study was approved by the Institutional Review Board of Soonchunhyang University Seoul Hospital (SCHUH 2023-08-002). Informed consent was waived since the data from the KNHANES were de-identified and publicly available.

2. Clinical data collection

The STOP questionnaire consisted of answering ‘yes’ or ‘no’ to a total of four items: snoring, daytime fatigue, observed apnea, and high blood pressure [19]. On the other hand, the STOP-Bang (STOP-Body mass index, Age, Neck circumference, Gender) questionnaire consisted of a total of eight questions, adding four items to the STOP questionnaire: body mass index (BMI, >30 kg/m2), age (>50 years), neck circumference (>40 cm), and sex (male), which was adjusted to Asian-Pacific criteria [19,20]. Each question in the STOP-Bang questionnaire was assigned a point value. A score of 3 or higher was considered a high-risk group, while a score lower than 3 was considered a low-risk group. In a sample of Korean community-dwelling participants (n=1,148), the modified STOP-Bang questionnaire demonstrated a sensitivity of 61.3% and a specificity of 79.6% for detecting overall OSA (apnea-hypopnea index [AHI] ≥5), with a positive predictive value (PPV) of 77.6% and a negative predictive value (NPV) of 64.2%. For screening moderate to severe OSA (AHI ≥15), the sensitivity was 72.4%, specificity was 67.8%, PPV was 42.9%, and NPV was 88.1% [20].
To measure lung function test, a portable spirometer, specifically a rolling dry-seal spirometer (Vmax series 2130, SensorMedics Corp., Yorba Linda, CA, USA) was administered to individuals aged 40 years and older. Trained healthcare workers administered the spirometry tests in accordance with the American Thoracic Society/European Respiratory Society guidelines [21]. The correlation between lung function measurements obtained from conventional and portable spirometry was excellent, with Pearson’s correlation coefficients of 0.986 for FVC and 0.994 for FEV1 [22]. Predicted values of FVC and FEV1 were calculated from measured values using Korean references [23]. The data on other lung functions including forced expiratory flow between 25% and 75% of vital capacity (FEF25-75), and peak expiratory flow (PEF) were also obtained. Participants were categorized into three groups based on their lung function results: normal (FEV1/FVC ≥0.7, FEV1 ≥80% predicted, and FVC ≥80% predicted), obstructive (FEV1/FVC <0.7), and preserved ratio impaired spirometry (PRISm, FEV1/FVC ≥0.7, and FEV1 <80% predicted). Impaired lung function was defined as FEV1 or FVC <80% of the predicted values.
In addition, the participants’ medical history and chronic respiratory symptoms (such as sputum production and cough lasting more than 3 months) were assessed using the KNHANES health questionnaire. Quality of life was evaluated using the European Quality of Life 5 Dimensions 3 Level Version (EQ-5D-3L), a generic tool for patient-reported outcome measurement, with the EQ-5D index calculated based on the unique quality of life weights specific to the Korean population [24].

3. Statistical analysis

All data were presented as either mean±standard deviation for continuous variables or as numbers and percentages (%) for categorical variables. Student’s t-test was used to compare continuous variables between the two groups, while the chi-square test was used for categorical variables. For comparisons among the three groups, one-way analysis of variance was used. The correlation between the STOP-Bang total score and clinical parameters was assessed using Pearson’s correlation coefficients (r). Univariate and multivariable logistic regression analyses were conducted to evaluate the risk factors associated with OSA in the high OSA risk group, reporting odds ratio (OR) and 95% confidence interval (CI). In the multivariable model, we adjusted for preselected covariates identified as risk factors or comorbidities of OSA, using the enter method. These covariates included age, sex, BMI, history of diabetes mellitus (DM) and hypertension, smoking status, and household income [4,6,25,26]. Binary logistic regression analyses were used to distinguish between participants in the high- and low-risk groups. Within these analyses, lung function was incorporated in two formats: as a continuous variable, and as a categorical variable, categorized into three groups (normal [reference], obstructive, PRISm) and two groups (FEV1/FVC ≥0.7 [reference] vs. FEV1/FVC <0.7). All statistical analyses were performed using the SPSS version 21.0 software (released 2012; IBM Corp., Armonk, NY, USA), with a two-tailed p-value less than 0.05 considered statistically significant.

Results

1. Baseline characteristics

Among 3,675 participants, the mean age was 58.6 years, and 42.6% were male. According to the STOP questionnaire, 600 individuals (16.3%) were classified as the high-risk group (STOP-Bang score ≥3), while 3,075 (83.7%) were categorized as the low-risk group (STOP score <3) (Table 1). Participants in the high-risk group were older, had higher BMI, increased waist and neck circumference, a higher proportion of males, current or former smokers, individuals with hypertension, dyslipidemia, DM, a history of myocardial infarction, gout, stroke, and a confirmed diagnosis of OSA compared with those in the low-risk group.

2. Quality of life

The high-risk group exhibited a lower percentage of participants reporting ‘no problem/pain/anxiety’ across all domains of mobility, self-care, usual activities, pain/discomfort, and anxiety/depression than the low-risk group (Table 2). In addition, the EQ-5D index was lower in the high-risk group than in the low-risk group.

3. Lung function, respiratory symptoms, and sleep behavior

When divided into two groups, participants in the high-risk group had lower values for FVC, FEV1, and FEV1/ FVC, but higher values for FEF25-75 and PEF compared to those in the low-risk group (Table 3). Within the high-risk group, there was a higher prevalence of patients with obstructive defects, PRISm, impaired FVC and FEV1, and chronic cough and sputum production than in the low-risk group. There were no significant differences in the duration of cough or sputum production between the two groups. Among all patients, the frequency of positive responses to the OSA STOP questionnaire items was highest for daytime tiredness, followed by snoring, and observed apnea. All these items had higher positive responses in the high-risk group than in the low-risk group. However, no significant differences in the sleep duration between the two groups were observed.

4. Correlation between STOP-Bang score and clinical parameters

The STOP-Bang score exhibited significant negative correlations with FVC% predicted (r=-0.225, p<0.001), FEV1% predicted (r=-0.123, p<0.001), FEF25-75 (r=-0.095, p<0.001), and FEV1/FVC (r=-0.242, p<0.001), while showing positive correlations with PEF (r=0.160, p<0.001), age (r=0.370, p<0.001), and BMI (r=0.278, p<0.001). In contrast, BMI was negatively associated with FVC% predicted (r=-0.214, p<0.001), but positively correlated with FEF25-75 (r=0.107, p<0.001), PEF (r=0.116, p<0.001), and FEV1/FVC (r=0.088, p<0.001) (Table 4).

5. Association between OSA risk and lung function

The mean STOP-Bang scores were higher in patients with the FVC <80% predicted, FEV1, <80% predicted than in those without (Figure 2A, B). The STOP-Bang score was highest in the obstructive group, followed by the PRISm and normal groups (Figure 2C). Patients with chronic cough or sputum production also had higher STOP-Bang scores than those without chronic cough (Figure 2D, E).
In the unadjusted model, several factors were associated with a high-risk of OSA, including non-obstructive disease, PRISm, lower FVC, FEV1 and FEV1/FVC, and higher FEF25-75, as well as the presence of chronic cough and sputum. However, in the covariate-adjusted models, chronic cough (OR, 2.413; 95% CI, 1.383 to 4.213; p=0.002) and sputum production (OR, 1.868; 95% CI, 1.166 to 2.992; p=0.009) remained significant predictors for the high OSA risk group (Table 5).

Discussion

We primarily aimed to explore the complex interplay between high-risk of OSA and lung function, using data from the KNHANES. Individuals with high-risk OSA exhibited a higher burden of comorbidities and diminished lung function, marked by reduced FVC and FEV1. In addition, they reported a notably lower quality of life and heightened respiratory symptoms, including chronic cough and sputum production than those in the low-risk group. Notably, chronic respiratory symptoms were found to be independently significant contributors to a high-risk of OSA, whereas lung function did not demonstrate a similar association in the multivariable analysis.
In our study, chronic cough and sputum production were found to be independently associated with a high-risk of OSA, which is consistent with previous research [27-30]. Kim et al. [27] reported a significant link between chronic cough and high STOP-Bang scores, with multivariable analysis revealing an OR of 2.230 (95% CI, 1.251 to 3.975) for STOP-Bang scores of 3 to 4 and an even stronger association with STOP-Bang scores of 5 to 8, where the OR was 6.614 (95% CI, 2.816 to 15.537) in the KNHANES dataset. Similarly, Wang et al. [30] found that among patients with chronic cough (n=131), the rate of chronic cough was significantly higher in the OSA group than in the non-OSA group (39.4% vs. 12.5%, p=0.005). The exact causes of the association between OSA and chronic cough and sputum are unclear, but several factors can be considered. OSA is characterized by partial or complete upper airway obstruction during sleep, resulting in episodes of reduced oxygen levels and restricted airflow [31]. These events may activate the respiratory muscles and irritate the airway, contributing to the development of cough and sputum symptoms. Additionally, it’s worth noting that OSA often coexists with comorbidities such as gastroesophageal reflux disease, asthma, and COPD [25,32], which may also contribute to a higher likelihood of experiencing chronic cough. These complex interactions warrant further investigation to better understand the mechanisms underlying these associations and improve the management of individuals with OSA and associated respiratory symptoms.
Our findings indicate a negative correlation between the STOP-Bang score and lung function, except for PEF. This negative correlation can be attributed to the high prevalence of obesity in patients with OSA, which often leads to a general impairment in lung function due to increased chest wall and abdominal fat, reduced chest wall compliance, and decreased respiratory muscle efficiency [33]. Indeed, despite individuals at high-risk of OSA showing lower lung function compared to the low-risk group, our multivariable analysis, adjusting for BMI, did not establish an independent association between lung function and OSA risk. This aligns with previous studies [14-16]. Sharma et al. [14] found a high prevalence of OSA in patients with conditions such as COPD or asthma; however, FEV1 was not independently associated with OSA risk. These results suggest that the initial association between lung function and OSA may be influenced by confounders such as body weight. Furthermore, Zerah-Lancner et al. [34] reported similar lung function across different OSA severity levels in participants matched for BMI.
Unlike other lung function parameters, PEF exhibited a positive correlation with the STOP-Bang score, which was likely due to its positive correlation with BMI and obesity indicators. Previous research has reported mixed findings, with some studies showing a positive correlation between PEF and BMI [35-37], whereas others have reported a negative correlation [38,39], resulting in varying outcomes. These contrasting correlations may be attributed to the nonlinear relationship between BMI and PEF. Bhardwaj et al. [40] indicated that in obese patients (BMI >23 kg/m2), PEF shows a negative correlation with BMI (r=-0.244, p=0.018), whereas in normal individuals (BMI <23 kg/m2), the correlation disappeared (r=0.070, p=0.645) in healthy Indian population (n=300). Our study, with an average BMI of 24.2 kg/m2 falling within the normal range, supports the possibility of a positive correlation between BMI and PEF.
Our study has several limitations that should be considered. First, we identified individuals at high-risk of OSA through questionnaires rather than diagnostic sleep studies, which might have introduced some degree of misclassification. However, the STOP-Bang questionnaire, adapted for Asian populations and utilized in our research, has shown reliable sensitivity and specificity in detecting OSA in the Korean population [20], thereby supporting the validity of our approach. Second, our study relied on cross-sectional data and lacked longitudinal follow-up data, limiting our ability to establish causal relationships. Additionally, we did not account for the major comorbidities associated with OSA, such as gastroesophageal reflux disease, which may have confounded our findings. Future research with diagnostic sleep studies, longitudinal designs, and comprehensive consideration of OSA-related comorbidities is warranted to further elucidate these associations. Despite these limitations, our study benefits from a large, nationally representative sample and a variety of variables, and contributes to understanding the link between OSA risk and lung function.
In conclusion, our study provides insights into the association between OSA risk and lung function in a large, nationally representative Korean population. Although we found that individuals with high-risk OSA exhibited lower lung function and higher burden of respiratory symptoms, our multivariable analysis did not show an independent association between lung function and OSA risk, suggesting that the initial associations may be influenced by confounding variables such as BMI. Further research should explore these intricate relationships, especially regarding chronic cough and sputum production in patients with OSA, and investigate comorbid conditions to enhance diagnostic and management strategies.

Notes

Authors’ Contributions

Conceptualization: Yoon HY. Methodology: Yoon HY. Formal analysis: Seok J. Data curation: Seok J. Software: Seok J. Validation: all authors. Investigation: Seok J. Writing - original draft preparation: all authors. Writing - review and editing: all authors. Approval of final manuscript: all authors.

Conflicts of Interest

Hee-Young Yoon is an editorial board member of the journal, but she was not involved in the peer reviewer selection, evaluation, or decision process of this article. No other potential conflicts of interest relevant to this article were reported.

Funding

This study was supported by the Soonchunhyang University Research Fund.

Fig. 1.
Enrollment of patients. STOP: Snoring, Tiredness during daytime, Observed apnea, and high blood Pressure.
trd-2023-0184f1.jpg
Fig. 2.
Comparisons of STOP-Bang (Snoring, Tiredness during daytime, Observed apnea, and high blood Pressure-Body mass index, Age, Neck circumference, Gender) scores according to the lung function abnormalities, and respiratory symptoms. (A) Forced expiratory volume per 1 second (FEV1), (B) forced vital capacity (FVC), (C) lung function types, (D) cough, and (E) sputum. ***p<0.001. PRISm: preserved ratio impaired spirometry.
trd-2023-0184f2.jpg
Table 1.
Comparison of baseline demographics between high and low OSA risk groups
Variable High-risk Low-risk Total p-value
Number 600 (16.3) 3,075 (83.7) 3,675
Age, yr 61.6±10.2 58.0±11.4 58.6±11.3 <0.001
Male sex 496 (82.7) 1,071 (34.8) 1,567 (42.6) <0.001
Household income 0.178
 1st quartile 160 (26.8) 703 (22.9) 863 (23.6)
 2nd quartile 141 (23.6) 760 (24.8) 901 (24.6)
 3rd quartile 140 (23.4) 803 (26.2) 943 (25.7)
 4th quartile 157 (26.3) 799 (26.1) 986 (26.1)
Ever smoker 428 (71.5) 1053 (34.3) 1,481 (40.3) <0.001
BMI, kg/m2 26.5±3.6 23.7±3.1 24.2±3.3 <0.001
Height, cm 167.4±8.2 161.0±8.6 162.1±8.8 <0.001
Weight, kg 74.4±12.2 61.7±10.2 63.7±11.6 <0.001
Waist circumference, cm 93.8±9.0 83.6±8.8 85.3±9.6 <0.001
Neck circumference, cm 38.6±3.0 34.4±2.9 35.1±3.3 <0.001
Comorbidities
 Hypertension 385 (64.2) 773 (25.1) 1,158 (31.5) <0.001
 Dyslipidemia 235 (39.2) 713 (23.2) 948 (25.8) <0.001
 Allergic rhinitis 69 (11.5) 378 (12.3) 447 (12.2) 0.635
 DM 144 (24.0) 293 (9.5) 437 (11.9) <0.001
 Osteoarthritis 32 (5.3) 350 (11.4) 382 (10.4) 0.172
 Sinusitis 41 (6.8) 163 (5.3) 204 (5.6) 0.244
 Depression 33 (5.5) 160 (5.2) 193 (5.3) 0.843
 Thyroid disease 22 (3.7) 150 (4.9) 172 (4.7) 0.283
 Tuberculosis 31 (5.2) 110 (3.6) 141 (3.8) 0.082
 Myocardial infarct 35 (5.8) 86 (2.8) 121 (3.3) <0.001
 Asthma 15 (2.5) 81 (2.6) 96 (2.6) 0.961
 Rheumatoid arthritis 17 (2.8) 73 (2.4) 90 (2.4) 0.602
 Angina 26 (4.3) 63 (2.0) 89 (2.4) 0.001
 Gout 29 (4.8) 49 (1.6) 78 (2.1) <0.001
 Stroke 19 (3.2) 55 (1.8) 74 (2.0) 0.041
 Thyroid cancer 6 (1.0) 57 (1.9) 63 (1.7) 0.193
 Atopy 12 (2.0) 47 (1.5) 59 (1.6) 0.507
 HBV infection 10 (1.7) 40 (1.3) 50 (1.3) 0.607
 Gastric cancer 9 (1.5) 31 (1.0) 40 (1.1) 0.397
 Colon cancer 11 (1.8) 28 (0.9) 39 (1.1) 0.071
 Lung cancer 5 (0.8) 7 (0.2) 12 (0.3) 0.047
 Chronic kidney disease 4 (0.7) 10 (0.3) 14 (0.4) 0.379
 OSA 13 (2.2) 7 (0.2) 20 (0.5) <0.001

Values are presented as number (%) or mean±standard deviation.

OSA: obstructive sleep apnea; BMI: body mass index; DM: diabetes mellitus; HBV: hepatitis B virus.

Table 2.
Comparison of quality of life between high and low obstructive sleep apnea risk groups
Variable High-risk Low-risk Total p-value
Number 600 (16.3) 3,075 (83.7) 3,675
Mobility <0.001
 No problem 465 (77.5) 2,632 (85.6) 3,097 (84.3)
 Some problems 129 (21.5) 439 (14.3) 568 (15.5)
 Extreme problems 6 (1.0) 4 (0.1) 10 (0.3)
Self-care <0.001
 No problem 559 (93.2) 2,986 (97.1) 3,545 (96.5)
 Some problems 38 (6.3) 83 (2.7) 121 (3.3)
 Extreme problems 3 (0.5) 6 (0.2) 9 (0.2)
Usual activities <0.001
 No problem 528 (88.0) 2,877 (93.6) 3,405 (92.7)
 Some problems 69 (11.5) 188 (6.1) 257 (7.0)
 Extreme problems 3 (0.5) 10 (0.3) 13 (0.4)
Pain/discomfort 0.022
 No pain 426 (71.0) 2,343 (76.2) 2,769 (75.3)
 Some pain 159 (26.5) 678 (22.0) 837 (22.8)
 Extreme pain 15 (2.5) 54 (1.8) 69 (1.9)
Anxiety/depression 0.028
 No anxiety 529 (88.2) 2,816 (91.6) 3,345 (91.0)
 Some anxiety 69 (11.5) 252 (8.2) 321 (8.7)
 Extreme anxiety 2 (0.3) 7 (0.2) 9 (0.2)
EQ-5D index 0.92±0.12 0.95±0.09 0.94±0.10 <0.001

Values are presented as number (%) or mean±standard deviation.

EQ-5D: European Quality of Life 5 Dimensions.

Table 3.
Comparison of lung function, respiratory symptoms, and sleep related symptoms between high and low obstructive sleep apnea risk groups
Variable High-risk Low-risk Total p-value
Number 600 (16.3) 3,075 (83.7) 3,675
Lung function rest
 FVC, % predicted 82.5±12.8 88.3±12.5 87.3±12.7 <0.001
 FEV1, % predicted 84.2±13.8 88.0±13.4 87.4±13.5 <0.001
 FEV1/FVC 0.75±0.08 0.77±0.07 0.77±0.07 <0.001
 FEF25-75, L 2.4±1.1 2.3±0.9 2.3±0.9 0.548
 PEF, L 7.3±2.2 6.4±1.9 6.6±2.0 <0.001
Categories of lung function abnormalities 0.001
 Normal 354 (59.0) 2,175 (70.7) 2,529 (68.8)
 Obstructive 122 (20.3) 361 (11.7) 483 (13.1)
 PRISm 124 (20.7) 539 (17.5) 663 (18.0)
 FVC <80% predicted 236 (39.3) 678 (22.0) 914 (24.9) <0.001
 FEV1 <80% predicted 200 (33.3) 764 (24.8) 964 (26.2) 0.008
Respiratory symptoms
 Cough 28 (4.7) 75 (2.4) 103 (2.8) 0.001
 Duration, mo 6.0 (2.0-20.0) 5.0 (1.0-10.0) 5.0 (2.0-10.0) 0.214
 Sputum 43 (7.2) 98 (3.2) 141 (3.8) <0.001
 Duration, mo 10.0 (2.5-20.0) 5.0 (1.0-10.0) 5.0 (2.0-10.0) 0.092
STOP questionnaire
 Snoring 393 (65.5) 304 (9.9) 697 (19.0) <0.001
 Tiredness during daytime 366 (61.0) 832 (27.1) 1,198 (32.6) <0.001
 Observed apnea 247 (41.2) 96 (3.1) 343 (9.3) <0.001
Sleep duration, hr
 Weekdays 6.5±4.0 6.7±3.3 6.6±3.3 0.468
 Weekend 6.9±4.0 7.2±3.3 7.1±3.4 0.149

Values are presented as number (%), mean±standard deviation, or median (interquartile range).

FVC: forced vital capacity; FEV1: forced expiratory volume per 1 second; FEF25-75: forced expiratory flow between 25% and 75% of vital capacity; PEF: peak expiratory flow; PRISm: preserved ratio impaired spirometry; STOP: Snoring, Tiredness during daytime, Observed apnea, and high blood Pressure.

Table 4.
Correlation between STOP-Bang score and clinical parameters
STOP-Bang score FVC, % predicted FEV1, % predicted FEF25-75 PEF FEV1/FVC Age BMI
STOP-Bang score r -0.225 -0.123 -0.095 0.160 -0.242 0.370 0.278
p-value <0.001 <0.001 <0.001 <0.001 <0.001 <0.001 <0.001
FVC, % predicted r 0.815 0.299 0.261 0.062 -0.255 -0.214
p-value <0.001 <0.001 <0.001 <0.001 <0.001 <0.001
FEV1, % predicted r 0.521 0.274 0.465 -0.049 -0.019
p-value <0.001 <0.001 <0.001 0.003 0.247
FEF25-75 r 0.597 0.742 -0.576 0.107
p-value <0.001 <0.001 <0.001 <0.001
PEF r 0.203 -0.423 0.116
p-value <0.001 <0.001 <0.001
FEV1/FVC r -0.364 0.088
p-value <0.001 <0.001
Age r 0.003
p-value 0.836
BMI r
p-value

The r-values were calculated using Pearson’s correlation coefficients.

STOP-Bang: Snoring, Tiredness during daytime, Observed apnea, and high blood Pressure-Body mass index, Age, Neck circumference, Gender; FVC: forced vital capacity; FEV1: forced expiratory volume per 1 second; FEF25-75: forced expiratory flow between 25% and 75% of vital capacity; PEF: peak expiratory flow; BMI: body mass index.

Table 5.
Univariate and multivariable logistic regression analysis for obstructive sleep apnea high-risk
Variable Univariate
Multivariable*
OR (95% CI) p-value OR (95% CI) p-value
Lung disease type
 Normal 1.000 (reference) 1.000 (reference)
 Obstructive 0.707 (0.565-0.886) 0.003 1.166 (0.862-1.575) 0.319
 PRISm 1.469 (1.107-1.950) 0.008 1.145 (0.864-1.516) 0.346
FVC, % predicted 0.968 (0.958-0.972) <0.001 0.999 (0.990-1.008) 0.784
FVC <80% predicted 2.292 (1.906-2.757) <0.001 1.109 (0.872-1.408) 0.394
FEV1, % predicted 0.980 (0.974-0.9860 <0.001 0.994 (0.869-1.001) 0.113
FEV1 <80% predicted 1.512 (1.253-1.826) <0.001 1.090 (0.862-1.378) 0.473
FEV1/FVC 0.959 (0.949-0.970) <0.001 0.991 (0.976-1.007) 0.257
FEV1/FVC <0.7 1.919 (1.529-2.408) <0.001 1.129 (0.842-1.515) 0.417
FEF25-75 1.032 (0.941-1.132) 0.504 0.958 (0.840-1.094) 0.527
PEF 1.251 (1.198-1.306) <0.001 1.028 (0.957-1.103) 0.450
Cough 1.958 (1.257-3.050) 0.003 2.413 (1.383-4.213) 0.002
Sputum 2.345 (1.620-3.394) <0.001 1.868 (1.166-2.992) 0.009

* Multivariable model adjusted for age, sex, body mass index, history of diabetes mellitus and hypertension, smoking status, and household income;

Categories of lung disease type: normal (FEV1/FVC ≥0.7, FEV1 ≥80% predicted, and FVC ≥80% predicted), obstructive (FEV1/FVC <0.7), and PRISm (FEV1/FVC ≥0.7 and FEV1 <80% predicted);

Reference group was FEV1/FVC ≥0.7.

OR: odds ratio; CI: confidence interval; PRISm: preserved ratio impaired spirometry; FVC: forced vital capacity; FEV1: forced expiratory volume per 1 second; FEF25-75: forced expiratory flow between 25% and 75% of vital capacity; PEF: peak expiratory flow.

REFERENCES

1. Sankri-Tarbichi AG. Obstructive sleep apnea-hypopnea syndrome: etiology and diagnosis. Avicenna J Med 2012;2:3-8.
crossref pmid pmc
2. Jordan AS, McSharry DG, Malhotra A. Adult obstructive sleep apnoea. Lancet 2014;383:736-47.
crossref pmid
3. Senaratna CV, Perret JL, Lodge CJ, Lowe AJ, Campbell BE, Matheson MC, et al. Prevalence of obstructive sleep apnea in the general population: a systematic review. Sleep Med Rev 2017;34:70-81.
crossref pmid
4. Sunwoo JS, Hwangbo Y, Kim WJ, Chu MK, Yun CH, Yang KI. Prevalence, sleep characteristics, and comorbidities in a population at high risk for obstructive sleep apnea: a nationwide questionnaire study in South Korea. PLoS One 2018;13:e0193549.
crossref pmid pmc
5. Benjafield AV, Ayas NT, Eastwood PR, Heinzer R, Ip MS, Morrell MJ, et al. Estimation of the global prevalence and burden of obstructive sleep apnoea: a literature-based analysis. Lancet Respir Med 2019;7:687-98.
crossref pmid pmc
6. Bonsignore MR, Baiamonte P, Mazzuca E, Castrogiovanni A, Marrone O. Obstructive sleep apnea and comorbidities: a dangerous liaison. Multidiscip Respir Med 2019;14:8.
crossref pmid pdf
7. Shawon MS, Perret JL, Senaratna CV, Lodge C, Hamilton GS, Dharmage SC. Current evidence on prevalence and clinical outcomes of co-morbid obstructive sleep apnea and chronic obstructive pulmonary disease: a systematic review. Sleep Med Rev 2017;32:58-68.
crossref pmid
8. Kong DL, Qin Z, Shen H, Jin HY, Wang W, Wang ZF. Association of obstructive sleep apnea with asthma: a meta-analysis. Sci Rep 2017;7:4088.
crossref pmid pmc pdf
9. Reis R, Antunes A. Lung volumes in the pathogenesis of obstructive sleep apnea. Rev Port Pneumol 2014;20:173-4.
crossref
10. Appelberg J, Nordahl G, Janson C. Lung volume and its correlation to nocturnal apnoea and desaturation. Respir Med 2000;94:233-9.
crossref pmid
11. Emilsson OI, Sundbom F, Ljunggren M, Benediktsdottir B, Garcia-Aymerich J, Bui DS, et al. Association between lung function decline and obstructive sleep apnoea: the ALEC study. Sleep Breath 2021;25:587-96.
crossref pmid pdf
12. Hoffstein V, Oliver Z. Pulmonary function and sleep apnea. Sleep Breath 2003;7:159-65.
crossref pmid pdf
13. Wang JF, Zhang Q, Xie YP, Chu YY, Ma W. Analysis of the overweight and obesity effects on pulmonary function in OSA patients. Lin Chuang Er Bi Yan Hou Tou Jing Wai Ke Za Zhi 2019;33:611-4.
pmid
14. Sharma B, Feinsilver S, Owens RL, Malhotra A, McSharry D, Karbowitz S. Obstructive airway disease and obstructive sleep apnea: effect of pulmonary function. Lung 2011;189:37-41.
crossref pmid pdf
15. Kim JS, Azarbarzin A, Podolanczuk AJ, Anderson MR, Cade BE, Kawut SM, et al. Obstructive sleep apnea and longitudinal changes in interstitial lung imaging and lung function: the MESA study. Ann Am Thorac Soc 2023;20:728-37.
crossref pmid
16. Wang TY, Lo YL, Lin SM, Huang CD, Chung FT, Lin HC, et al. Obstructive sleep apnoea accelerates FEV1 decline in asthmatic patients. BMC Pulm Med 2017;17:55.
crossref pmid pmc pdf
17. Oh K, Kim Y, Kweon S, Kim S, Yun S, Park S, et al. Korea National Health and Nutrition Examination Survey, 20th anniversary: accomplishments and future directions. Epidemiol Health 2021;43:e2021025.
crossref pmid pmc
18. Kweon S, Kim Y, Jang MJ, Kim Y, Kim K, Choi S, et al. Data resource profile: the Korea National Health and Nutrition Examination Survey (KNHANES). Int J Epidemiol 2014;43:69-77.
crossref pmid pmc
19. Chung F, Yegneswaran B, Liao P, Chung SA, Vairavanathan S, Islam S, et al. STOP questionnaire: a tool to screen patients for obstructive sleep apnea. Anesthesiology 2008;108:812-21.

20. Jeon HJ, Bang YR, Yoon IY. A validation study on three screening questionnaires for obstructive sleep apnea in a Korean community sample. Sleep Breath 2019;23:969-77.
crossref pmid pdf
21. Graham BL, Steenbruggen I, Miller MR, Barjaktarevic IZ, Cooper BG, Hall GL, et al. An official American Thoracic Society and European Respiratory Society technical statement. Am J Respir Crit Care Med 2019;200:e70-88.
crossref pmid pmc
22. Park HJ, Rhee CK, Yoo KH, Park YB. Reliability of portable spirometry performed in the Korea National Health and Nutrition Examination Survey compared to conventional spirometry. Tuberc Respir Dis (Seoul) 2021;84:274-81.
crossref pmid pmc pdf
23. Choi JK, Paek D, Lee JO. Normal predictive values of spirometry in Korean population. Tuberc Respir Dis 2005;58:230-42.
crossref
24. Lee YK, Nam HS, Chuang LH, Kim KY, Yang HK, Kwon IS, et al. South Korean time trade-off values for EQ-5D health states: modeling with observed values for 101 health states. Value Health 2009;12:1187-93.
crossref pmid
25. Huh G, Han KD, Park YM, Park CS, Lee KN, Lee EY, et al. Comorbidities associated with high-risk obstructive sleep apnea based on the STOP-BANG questionnaire: a nationwide population-based study. Korean J Intern Med 2022;38:80-92.
crossref pmid pmc pdf
26. Wetter DW, Young TB, Bidwell TR, Badr MS, Palta M. Smoking as a risk factor for sleep-disordered breathing. Arch Intern Med 1994;154:2219-24.
crossref pmid
27. Kim TH, Heo IR, Kim HC. Impact of high-risk of obstructive sleep apnea on chronic cough: data from the Korea National Health and Nutrition Examination Survey. BMC Pulm Med 2022;22:419.
crossref pmid pmc pdf
28. Chan KK, Ing AJ, Laks L, Cossa G, Rogers P, Birring SS. Chronic cough in patients with sleep-disordered breathing. Eur Respir J 2010;35:368-72.
crossref pmid
29. Birring SS, Ing AJ, Chan K, Cossa G, Matos S, Morgan MD, et al. Obstructive sleep apnoea: a cause of chronic cough. Cough 2007;3:7.
crossref pmid pmc
30. Wang TY, Lo YL, Liu WT, Lin SM, Lin TY, Kuo CH, et al. Chronic cough and obstructive sleep apnoea in a sleep laboratory-based pulmonary practice. Cough 2013;9:24.
crossref pmid pmc pdf
31. Patil SP, Schneider H, Schwartz AR, Smith PL. Adult obstructive sleep apnea: pathophysiology and diagnosis. Chest 2007;132:325-37.
crossref pmid
32. Sundar KM, Daly SE, Pearce MJ, Alward WT. Chronic cough and obstructive sleep apnea in a community-based pulmonary practice. Cough 2010;6:2.
crossref pmid pmc
33. Banerjee J, Roy A, Singhamahapatra A, Dey PK, Ghosal A, Das A. Association of body mass index (BMI) with lung function parameters in non-asthmatics identified by spirometric protocols. J Clin Diagn Res 2014;8:12-4.
crossref pmid pmc
34. Zerah-Lancner F, Lofaso F, Coste A, Ricolfi F, Goldenberg F, Harf A. Pulmonary function in obese snorers with or without sleep apnea syndrome. Am J Respir Crit Care Med 1997;156(2 Pt 1):522-7.
crossref pmid
35. Ijaz A, Bashir I, Ikhlaq A, Ijaz F, Aftab RK, Zia R. Correlation between peak expiratory flow rate, markers of adiposity, and anthropometric measures in medical students in Pakistan. Cureus 2020;12:e12408.
crossref pmid pmc
36. Ali R, Shaikh S, Siddiqui N, Fahad M, Jawed S, Masood N. Impacts of adiposity parameters on peak expiratory flow rate in healthy young adults of Bahria University Medical and Dental College Karachi: cross-sectional study. J Pak Med Assoc 2022;72:1513-7.
crossref pmid
37. Joshi V, Shah S. Effect of body mass index (BMI) on peak expiratory flow rate in young adults. Int Arch Integr Med 2016;3:85-8.

38. Al Ghobain M. The effect of obesity on spirometry tests among healthy non-smoking adults. BMC Pulm Med 2012;12:10.
pmid pmc
39. Gundogdu Z, Eryilmaz N. Correlation between peak flow and body mass index in obese and non-obese children in Kocaeli, Turkey. Prim Care Respir J 2011;20:403-6.
crossref pmid pmc
40. Bhardwaj P, Poonam K, Jha K, Bano M. Effects of age and body mass index on peak-expiratory flow rate in Indian population. Indian J Physiol Pharmacol 2014;58:166-9.
pmid


ABOUT
ARTICLE & TOPICS
Article category

Browse all articles >

Topics

Browse all articles >

BROWSE ARTICLES
FOR CONTRIBUTORS
Editorial Office
101-605, 58, Banpo-daero, Seocho-gu (Seocho-dong, Seocho Art-Xi), Seoul 06652, Korea
Tel: +82-2-575-3825, +82-2-576-5347    Fax: +82-2-572-6683    E-mail: katrdsubmit@lungkorea.org                

Copyright © 2024 by The Korean Academy of Tuberculosis and Respiratory Diseases. All rights reserved.

Developed in M2PI

Close layer
prev next