Tuberc Respir Dis > Volume 87(2); 2024 > Article
Rath, Sahu, and De: Oscillometry-Defined Small Airway Dysfunction in Patients with Chronic Obstructive Pulmonary Disease

Abstract

Background

The prevalence of small airway dysfunction (SAD) in patients with chronic obstructive pulmonary disease (COPD) across different ethnicities is poorly understood. This study aimed to estimate the prevalence of SAD in stable COPD patients.

Methods

We conducted a cross-sectional study of 196 consecutive stable COPD patients. We measured pre- and post-bronchodilator (BD) lung function and respiratory impedance. The severity of COPD and lung function abnormalities was graded in accordance with the Global Initiative for Chronic Obstructive Lung Disease (GOLD) guidelines. SAD was defined as either difference in whole-breath resistance at 5 and 19 Hz > upper limit of normal or respiratory system reactance at 5 Hz < lower limit of normal.

Results

The cohort consisted of 95.9% men, with an average age of 66.3 years. The mean forced expiratory volume 1 second (FEV1) % predicted was 56.4%. The median COPD assessment test (CAT) scores were 14. The prevalence of post-BD SAD across the GOLD grades 1 to 4 was 14.3%, 51.1%, 91%, and 100%, respectively. The post-BD SAD and expiratory flow limitation at tidal breath (EFLT) were present in 62.8% (95% confidence interval [CI], 56.1 to 69.9) and 28.1% (95% CI, 21.9 to 34.2), respectively. COPD patients with SAD had higher CAT scores (15.5 vs. 12.8, p<0.01); poor lung function (FEV1% predicted 46.6% vs. 72.8%, p<0.01); lower diffusion capacity for CO (4.8 mmol/min/kPa vs. 5.6 mmol/min/kPa, p<0.01); hyperinflation (ratio of residual volume to total lung capacity % predicted: 159.7% vs. 129%, p<0.01), and shorter 6-minute walk distance (367.5 m vs. 390 m, p=0.02).

Conclusion

SAD is present across all severities of COPD. The prevalence of SAD increases with disease severity. SAD is associated with poor lung function and higher symptom burden. Severe SAD is indicated by the presence of EFLT.

Introduction

Chronic obstructive pulmonary disease (COPD) is a leading cause of mortality and morbidity with a high economic and social burden globally [1]. Small airways are the major sites of pathology in many respiratory diseases, including COPD [2]. The airways distal to the 8th generation are small airways with an internal diameter <2 mm. Small airways include a portion of conducting airways and gas-exchanging areas [2]. Small airway dysfunction (SAD) is considered a precursor for the development of emphysema [3]. Mucous hypersecretion, mucous plugging of the small airways, and immune cell infiltration are the pathophysiological mechanisms of SAD in COPD [3].
There are no standard criteria for diagnosing SAD [4]. Large airways substantially contribute to forced expiratory volume 1 second (FEV1) [5]. Therefore, FEV1 is not specific to SAD. Maximal mid-expiratory flow (MMEF) <65% predicted is considered a predictor of SAD in spirometry [4]. However, MMEF has poor reproducibility and high variability in detecting SAD [2,5]. Respiratory impedance measured by the forced oscillation technique and impulse oscillometry is an easy, effort-independent, and noninvasive technique for diagnosing SAD [5]. Impedance parameters such as respiratory system reactance at 5 Hz (X5), the difference in whole-breath resistance at 5 and 20 Hz (R5-20), resonant frequency, and the area under the reactance curve between 5 Hz and resonant frequency are used to diagnose SAD [4]. The prevalence of SAD in patients with COPD and its association with clinical parameters and the effects of treatment, especially in the Indian population, has not been explored.
The primary objective of this study was to estimate the prevalence of SAD in stable COPD patients using oscillometry and to determine its association with lung function, COPD assessment test (CAT) scores, and a 6-minute walk test (6MWT). The secondary objective was to assess changes in impedance, lung function, and symptom burden after 3 months of Global Initiative for Chronic Obstructive Lung Disease (GOLD) guided treatment.

Materials and Methods

1. Study design and population

We prospectively screened consecutive patients aged >40 years from the outpatient department between August 2021 and January 2023. The diagnosis of COPD was made according to the GOLD guidelines with a ratio of post-bronchodilator (post-BD) FEV1 and forced vital capacity (FVC) <0.70. The exclusion criteria were a history of acute COPD exacerbation or hospitalization within 4 weeks before recruitment, structural lung diseases, including active or previous tuberculosis, bronchiectasis, and moderate to severe coronavirus disease 2019 (COVID-19) in the past 12 months.
The Institutional Ethics Committee, All India Institute of Medical Sciences, Raipur (India) approved the study protocol (No: 1863/IEC-AIIMSRPR/2021 date 21/08/2021). Written informed consent was obtained from all participants. This study was conducted in accordance with good clinical practices and the Declaration of Helsinki.

2. Assessments

At the baseline visit, demographic information, including sex, age, height, weight, smoking history, medication history, comorbidities, and the number of previous COPD exacerbations, was collected. The impact of COPD symptoms on health status was assessed using CAT scores (Hindi translation). Based on the history of previous exacerbations and CAT scores, the severity of COPD was graded as per the GOLD guidelines [1].

3. Forced oscillation technique

The respiratory system resistance and reactance were measured at 5, 11, and 19 Hz, respectively, using a Resmon Pro Full device (RestechSrl, Milan, Italy) as per the recommendations of the European Respiratory Society [6]. At least three tests were performed, and each continued until ten accepted breaths were recorded. The mean of three trials was used for analysis only if the coefficient of variation for R5 was <10%. The evaluated parameters were whole- and within-breath respiratory system resistance at 5 Hz (R5) and X5, the difference in inspiratory and expiratory reactance at 5 Hz (∆X5), and the difference in whole-breath resistance at 5 and 19 Hz (R5-19). The regression equations of oscillometry for the Indian population were used to define the upper limit of normal (ULN) and lower limit of normal (LLN) [7]. SAD was defined as R5-19 >ULN or X5 <LLN. The expiratory flow limitation at tidal breath (EFLT) was defined as ∆X5 ≥0.28 kPa/L/sec [8].

4. Spirometry

After oscillometry, the patient underwent spirometry, including body plethysmography and single-breath CO diffusion capacity, using PowerCube Body+ (GANSHORN Medizin Electronic, Niederlauer, Germany) as per the American Thoracic Society/European Respiratory Society recommendations [9]. Predictive equations of the spirometry parameters for the Indian population were used [10]. In our study, an MMEF <65% of predicted is considered to be a spirometry-defined SAD. The diffusing capacity of the lungs for carbon monoxide (DLCOc) was adjusted for hemoglobin. The Global Lung Initiative 2012 predictive equations for lung volumes and DLCOc were used [11].
Both lung function tests and oscillometry were repeated 15 minutes after 400 μg salbutamol inhalation from a metered-dose inhaler with a spacer device. Post-BD reversibility in spirometry was defined as a ≥12% increase from the pre-BD value and a ≥0.2 L increase in either FEV1 or FVC. As per the GOLD guidelines, the severity of airflow obstruction was classified on the basis of post-BD FEV1% of the predicted value [1]. The bronchodilator responsiveness of R5 was defined as a (-)40% decrease and a (+)50% increase in X5 from the pre-BD value [5].
A 6MWT was performed on an undisturbed 30-m hospital corridor according to standard guidelines [12]. We measured the 6-minute walk distance (6MWD), desaturation after the test, and the change in dyspnea score using the Borg score. All investigations as mentioned above were repeated during follow-up visits at 3 to 6 months.

5. Statistical analysis

The data were analyzed using IBM SPSS statistics for Windows version 23.0 (IBM Corp., Armonk, NY, USA). Data are presented as the standard deviation for continuous variables and frequency (percentage) or median (interquartile range [IQR]) for nominal variables. Unpaired and paired t-tests, Pearson χ2 tests, and analysis of variance (ANOVA) with post hoc tests were used for comparisons where appropriate. Relationships across parameters were examined using Pearson’s correlation coefficient (r). A value of p<0.05 was considered statistically significant.

Results

1. Patient characteristics

We recruited 330 patients, of whom 196 were eligible for the study. The details of the study population enrollment are shown in Figure 1. Our study cohort was mostly male (95.9%), and the mean age was 63.3 years. The demographic and clinical profiles of the study population are summarized in Table 1. Nearly half of the study population was treatment naïve (n=100, 51%). The majority was either current or ex-smokers (86.7%). The median pack-years of smoking were 32.9 pack-years. According to the GOLD taxonomy, the distributions of COPD-C, COPD-P, and COPD-U were 80.1%, 14.3%, and 5.6%, respectively. Most patients were in GOLD group B (54.6%), followed by group E (26.5%). The median peripheral blood eosinophil count was 120/mm3 (IQR, 30 to 230). The most common comorbid was systemic hypertension (32.1%), followed by diabetes mellitus (24.5%).

2. Forced oscillation technique

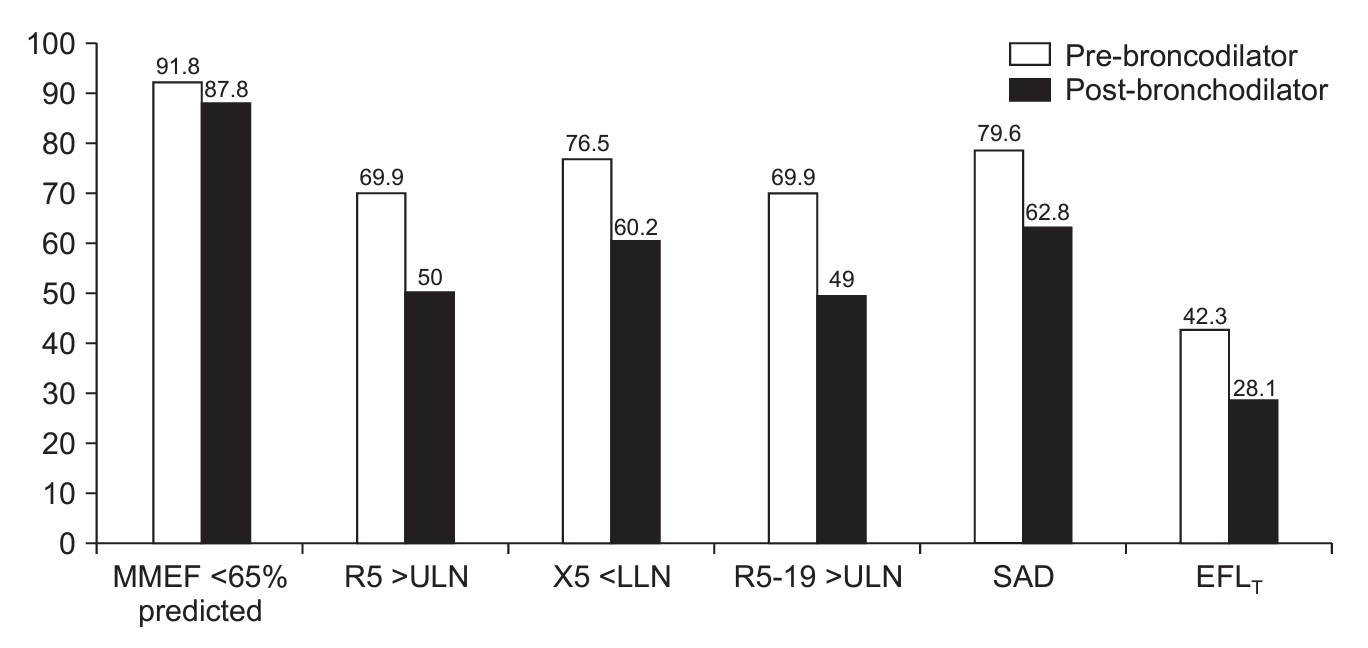
The coefficient of variation of the R5 measurements was 5.37%±2.59%. Post-BD normal R5 (≤ULN), X5 (≥LLN), and R5-19 (≤ULN) were observed in 50%, 39.8%, and 51% of the patients, respectively. Pre-BD SAD was observed in 79.6% of the patients, which was reduced to 62.8% (95% confidence interval [CI], 56.1 to 69.9) after post-BD (Figure 2). The prevalence of preBD EFLT was 42.3%, but it was reduced to 28.1% (95% CI, 21.9 to 34.2) in post-BD. The prevalence of SAD was similar in both treatment-naive and those already on-treatment for COPD (50.4% vs. 49.6%, p>0.05). The bronchodilator responsiveness of R5 and X5 was 11.2% and 15.8%, respectively. A paradoxical bronchodilator response in X5 (i.e., >50% increase) was observed in 2.5% of the cohort. Large airway dysfunction, i.e., postBD R19 >ULN, was observed in 38.5% of the patients. Isolated large airway dysfunction without underlying SAD was observed in 8.7% of the patients.

3. Baseline lung function parameters

The mean post-BD FEV1% predicted of the cohort was 56.4% (Table 1). Bronchodilator responsiveness in FEV1 and FVC was observed in 26.5% and 42.3%, respectively. According to the GOLD classification, the majority of the patients had grade 2 (44.9%), followed by grade 3 (33.2%) airflow obstruction. The mean MMEF of the cohort was 38.3% of the predicted. Spirometry-defined SAD was observed in 87.8% of the patients. The mean total lung capacity (TLC) was 5.6 L. The median DLCOc was 65% of that predicted.

4. COPD severity

The age of the patients was not different across the GOLD grades (Table 1). Post hoc analysis CAT scores were not significantly different among GOLD grades 2-4. The severity of air trapping (ratio of residual volume to TLC [RV/TLC], % of predicted) and impairment in DLCOc increased with the severity of GOLD grading. Higher GOLD grading was significantly associated with respiratory impedance abnormalities, including SAD. The prevalence of EFLT also significantly increased with higher GOLD grades. Post hoc analysis showed that R5 and R19 were not different between GOLD grades 3 and 4. Reduced 6MWD, increased desaturation, and dyspnea during 6MWT were observed in patients with higher COPD grades. The prevalence of spirometry-defined SAD was significantly higher than that of oscillometer-defined SAD, irrespective of the severity of COPD (87.8% vs. 62.8%, p<0.01).
The lung function parameters across the GOLD grouping of COPD patients are presented in Table 2. The FEV1% predicted, MMEF% predicted, and DLCOc reduced significantly in the higher GOLD groups. R5, X5, R5-19, and the prevalence of SAD also increased in the higher GOLD groups. The abnormalities in large airways, i.e., R19 >ULN, were not different between GOLD group B and E. The prevalence of EFLT was also not different across the GOLD groups. The COPD patients in the higher GOLD groups had significantly shorter 6MWD (p<0.01).

5. COPD patients with SAD

COPD patients with oscillometry-defined SAD had more severe airflow obstruction (post-BD FEV1% of predicted 46.6% vs. 72.8%, p<0.01), more air trapping (post-BD RV/TLC% of predicted 159.7% vs. 129%, p<0.01), and reduced DLCOc, but had similar TLC (Table 3). COPD patients with SAD had significantly reduced 6MWD, more desaturation, and more breathlessness than those without SAD.
We observed that 44.7% (95% CI, 36.6 to 53.7) of COPD patients with SAD had EFLT. COPD patients with the EFLT phenotype had significantly more severe lung function impairment, including diffusion impairment, than those with SAD and without EFLT (Table 4). COPD patients with EFLT reported more severe breathlessness after a 6MWT. However, the desaturation and distance covered during the 6MWT were not different between the groups. The univariate correlation between the CAT score, lung function, and impedance parameters was low (r<0.3) but significant (p<0.05).

6. Follow-up

Patients received either single or combinations of inhaled long-acting bronchodilators and or inhaled corticosteroids based on GOLD recommendations. A total of 72 patients reported for follow-up. Of these, 59 patients were eligible for follow-up evaluation; the reasons for these exclusions are mentioned in Figure 1. The mean interval between baseline and follow-up visits was 4.1±2.2 months. Except for the improvement in the CAT scores and R5, there were no significant improvements in lung function or impedance parameters (Table 5).

Discussion

This study explored the prevalence of oscillometry-defined SAD in a cohort of stable COPD patients. This study highlights the high prevalence of SAD and EFLT in patients with COPD, particularly in those with severe diseases. The prevalence of oscillometry-defined SAD was significantly lower than that of spirometry-defined SAD across all COPD severities. The presence of SAD in patients with COPD signifies severe lung function impairment and a higher symptom burden.
The involvement of small airways is part of the natural history of COPD. Computed tomography of resected lung samples of patients with COPD demonstrated narrowing of small airways that appear before the onset of emphysema and increase with the disease severity [13].
The GOLD guidelines recommend post-BD spirometry parameters to define the severity of airflow obstruction in patients with COPD [1]. Whether post-BD impedance can be used to assess SAD in COPD remains to be determined [6]. However, to maintain uniformity with the spirometry parameter, we used the post-BD impedance parameters. The bronchodilator response in respiratory impedance (either R5 or X5) was significantly less than that in spirometry (20.4% vs. 49.5%, p<0.01). The bronchodilator response in the spirometry parameters of our cohort was similar to that reported in a previous study [14].
Various investigators have investigated the prevalence of oscillometry-defined SAD in COPD and its impact [15-18]. However, the impedance parameters and cutoff values used to define SAD in these studies were diverse. Using a fixed R5-20 cutoff (>0.03 kPa/L/sec), Pisi et al. [15] observed that 80% of COPD patients (n=100) had SAD. Crisafulli et al. [16] reported a lower prevalence of SAD in COPD patients (n=202) with a higher R5-20 cutoff (≥0.07 kPa/L/sec). Based on the pre-BD R5-19 cutoff ≥0.07 kPa/L/sec, the prevalence of SAD in our study was 82.7%, which is slightly higher than that in previous studies. Crim et al. [17] evaluated respiratory impedance in the Evaluation of COPD Longitudinally to Identify Predictive Surrogate Endpoints (ECLIPSE) cohort of COPD patients (n=2,054). They observed beyond normal X5, R20, and R5-20 in 66%, 14%, and 60%, respectively. The prevalance of abnormal X5 in our study was similar, but the R19 ≥ULN was higher. We also observed abnormality in large airways, i.e., R19 was independent of underlying SAD. Recently, Lu et al. [18] used the ULN or LLN of the local population to assess abnormal respiratory impedance in COPD patients (n=768) of the Early Chronic Obstructive Pulmonary Disease (ECOPD) cohort from China. The proportion of impairment in R5, X5, and R5-20 in their study varied from 52.9% to 62.5%, similar to our observations. The prevalence of SAD across studies was variable because of the variable proportion of severe COPD in the cohorts, parameters used to define SAD, cutoff values, and probably different ethnicities.
We observed that the prevalence of SAD progressed with GOLD severity, and all patients with GOLD grade 4 had SAD. Similarly, Lu et al. [18] observed that the abnormality in impedance progressively increased from 25% to 100% in GOLD stages 1 to 4. Crisafulli et al. [16] also reported progressively increasing SAD prevalence with GOLD severity.
Collapsing of the small airways during tidal breath increases the ∆X5. A higher RV/TLC% reduces elastic lung recoil and increases ∆X5 in COPD patients [19]. A threshold value of ∆X5 ≥0.28 kPa/L/sec during tidal breathing has high specificity and sensitivity to diagnose EFLT [8]. Paredi et al. [20] observed that ∆X5 in COPD patients was higher than that in asthma patients, and ∆X5 can differentiate between these two diseases. Beech et al. [21] observed that 47.8% of COPD patients (n=70) had EFLT. Dean et al. [22] found that 37.4% of COPD patients (n=147) had EFLT. The pre-BD EFLT of our cohort was 41.3%, which is comparable to both studies [21,22]. Mikamo et al. [19] examined the effects of EFLT among 74 patients with COPD using a lower cutoff of ∆X5 (0.55 cm H2O/L/sec). All the above studies reported that the presence of EFLT was associated with a significantly higher lung function abnormality, but the effects on symptom scores varied across the studies. Aarli et al. [23] observed that COPD patients (n=425) with ∆X5 ≥ULN were associated with poor exercise performance, more exacerbations, more hospitalizations, and higher mortality. We observed that EFLT was present in a subgroup of COPD patients with SAD and the presence of EFLT was associated with further lung function impairment.
Anderson and Lipworth [24] observed that the severity of dyspnea, measured by the Medical Research Council dyspnea score, had a poor correlation with respiratory impedance and lung function parameters. Crisafulli et al. [16] reported a significant correlation between R5-20 and CAT. The correlation coefficient between impedance parameters and the CAT score in our study was weaker than that in previous studies. In the present study, 6MWD and desaturation during 6MWT showed a significant but weak correlation with lung function and impedance parameters.
Dean et al. [22] reported no significant changes in ∆X5 values in patients with COPD between baseline and after 2 years of treatment, irrespective of baseline EFLT. Beech et al. [21] also observed that despite 6 months of treatment, EFLT persisted in the majority of patients. Crim et al. [17] found little variability in impedance parameters over 3 months. In our study, the prevalence of SAD was similar between treatment-naïve and on-treatment patients, and there was little variability in impedance parameters after 3 months of treatment.
This study had several limitations. It was a cross-sectional study conducted at a single center. Because this was a hospital-based study, severe COPD and symptomatic patients constituted most of the cohort. There were few female patients because smoking is less prevalent among Indian women. Few patients attended follow-up visits. Because an older version of the oscillometry software was used during the study, we could not measure the resonant frequency and the resonant area for all the patients.
The major strength of this study was the use of ULN and LLN of the local population to define abnormalities in respiratory impedance. Post-BD impedance was used to define abnormalities and maintain uniformity with spirometry parameters.
In conclusion, SAD and expiratory flow limitation are present across all COPD severities. The prevalence of SAD increases with increasing GOLD grades. The bronchodilator responsiveness of the impedance parameters in patients with COPD was significantly less than that of the spirometry-defined SAD. The presence of SAD was associated with poor lung function, higher symptom burden, and more desaturation during 6MWT. SAD in patients with COPD remains unaffected despite optimal treatment. A larger cohort and long-term follow-up are necessary to understand the long-term implications of SAD in COPD patients. There is a need to develop a consensus on whether pre- or post-BD impedance parameters should be used to assess oscillometry abnormalities in patients with COPD.

Notes

Authors’ Contributions

Conceptualization: De S. Methodology: Sahu D, De S. Formal analysis: Rath AK, De S. Data curation: Rath AK, Sahu D. Software: Rath AK, De S. Validation: Rath AK, De S. Investigation: all authors. Writing - original draft preparation: all authors. Writing - review and editing: all authors. Approval of final manuscript: all authors.

Conflicts of Interest

No potential conflict of interest relevant to this article was reported.

Funding

No funding to declare.

Acknowledgments

The authors would like to thank all the participants in this study, Ms. Rajyalakshmi Kundrapu and Mr. Bheem Prasad Jaiswal.

Fig. 1.
Flow chart of patient enrollment. *A few patients were not able to perform all the tests. COVID-19: coronavirus disease 2019; CoV: cofficient of variation; 6MWT: 6-minute walk test; DLCO: diffusing capacity for carbon monoxide; PFT: pulmonary function test.
trd-2023-0139f1.jpg
Fig. 2.
Distribution of pre- and post-bronchodilator small airway dysfunction. MMEF: maximal mid-expiratory flow; R5: respiratory system resistance at 5 Hz; ULN: upper limit of normal; X5: respiratory system reactance at 5 Hz; LLN: lower limit of normal; R5-19: difference in whole-breath resistance at 5 and 19 Hz; SAD: small airway dysfunction; EFLT : expiratory flow limitation at tidal breath.
trd-2023-0139f2.jpg
Table 1.
Comparison of demographic and lung function parameters according to the severity of airflow obstruction (GOLD classification)
Variable Total (n=196) GOLD grade 1 (n=28) GOLD grade 2 (n=88) GOLD grade 3 (n=65) GOLD grade 4 (n=15) p-value
Age, yr 63.3±8.4 64.5±5.2 63.4±9.4 63.6±7.9 58.7±9.2 0.17
Male sex 188 (95.9) 25 (89.3) 86 (99.7) 62 (95.4) 15 (100) 0.21
BMI, kg/m2 22.5±4.8 23.7±4.1 22.4±4.1 22.6±5.8 20.3±4.9 0.19
Smoker 168 (86.7) 21 (75.0) 76 (86.4) 59 (90.8) 12 (80.0) 0.51
Pack-years 32.9 (15-52) 36.9 (10.7-56.7) 26.9(14-55.3) 40 (17.8-52) 26.3 (18.3-45.1) 0.78
CAT score 14.5±6.1 10.7±4.6 14.4±6.6 15.9±5.4 15.5±5.9 <0.01*
CAT score ≥10 155 (79.1) 17 (60.7) 69 (78.4) 58 (89.2) 11 (73.3) 0.02*
Absolute eosinophil count 120 (30-230) 120 (30-230) 120 (20-230) 120 (30-235) 110 (60-210) 0.83
GOLD group A 37 (18.9) 11 (39.3) 17 (19.3) 6 (9.2) 3 (20.0) 0.05
GOLD group B 107 (54.6) 13 (46.4) 48 (54.5) 39 (60.0) 7 (46.7)
GOLD group E 52 (26.5) 4 (14.3) 23 (26.1) 20 (30.8) 5 (33.3)
Post-BD FEV1, L 1.26±0.49 1.96±0.51 1.41±0.31 0.91±0.16 0.60±0.11 <0.01*
Post-BD FEV1, % predicted 56.4±20.2 91.5±11.6 62.1±8.1 40.7±6.0 25.2±2.61 <0.01*
Post-BD FEV1/FVC 53.6±10.3 65.6±6.3 56.6±7.4 48.0±7.7 37.1±3.74 <0.01*
Post-BD MMEF, % of predicted 38.3±20.5 72.7±18.9 41.3±12.7 24.9±7.7 13.7±2.7 <0.01*
Post-BD MMEF <65% of predicted 172 (87.8) 9 (32.1) 83 (94.3) 65 (100) 15 (100) <0.01*
Post-BD sRaw, kPa/sec 2.77±2.34 1.07±0.55 1.88±1.26 3.50±1.38 8.02±3.75 <0.01*
Post-BD TLC, L 5.6±1.05 5.42±0.96 5.63±1.08 5.49±1.03 6.02±1.13 0.25
Post-BD RV/TLC, % of predicted 148.3±29.7 114.1±20.0 141.1±19.1 161.3±21.2 197.9±33.9 <0.01*
DLCOc, mmol/min/kPa 5.11±1.56 5.81±1.36 5.25±1.67 4.82±1.29 4.15±1.77 <0.01*
kCo, % of predicted 85.8±22.71 88.1±21.0 84.9±21.5 88.3±23.6 74.7±27.5 0.21
Post-BD R5, cm H2O/L/sec 5.12±1.73 3.71±1.32 4.65±1.56 6.05±1.52 6.45±1.15 <0.01*
Post-BD R5 >ULN 98 (50.0) 3 (10.7) 28 (31.8) 52 (80.0) 15 (100) <0.01*
Post-BD X5, cm H2O/L/sec -3.25±2.32 -1.33±0.71 -2.43±1.75 -4.44±2.05 -6.41±2.67 <0.01*
Post-BD X5 <LLN 118 (60.2) 3 (10.7) 42 (47.7) 58 (89.2) 15 (100) <0.01*
Post-BD ∆X5, cm H2O/L/sec 2.08±2.56 0.15±0.66 1.31±2.01 3.31±2.54 4.87±3.06 <0.01*
Post-BD R19, cm H2O/L/sec 3.62±1.04 3.21±0.99 3.47±1.0 3.93±1.06 3.61±1.04 <0.01*
Post-BD R19 >ULN 75 (38.5) 4 (14.3) 27 (30.7) 36 (56.3) 8 (53.3) <0.01*
Post-BD R5-19, cm H2O/L/sec 1.21±0.99 0.38±0.59 0.87±0.79 1.71±0.80 2.63±0.81 <0.01*
Post-BD R5-19 >ULN 96 (48.9) 3 (10.7) 27 (30.7) 51 (78.5) 15 (100) <0.01*
Post-BD SAD 123 (62.8) 4 (14.3) 45 (51.1) 59 (90.8) 15 (100) <0.01*
Post-BD EFLT 55 (28.1) 0 12 (13.6) 33 (50.8) 10 (66.7) <0.01*
6MWD, m 376.0±69.3 398.9±64.4 385.4±66.3 363.0±71.2 334.0±64.7 <0.01*
Desaturation during 6MWT, % 4.4±4.2 2.1±2.1 4.0±4.2 5.3±3.9 7.6±5.3 <0.01*
Change in the Borg score after 6MWT 2.38±1.75 1.39±1.29 2.23±1.73 2.85±1.86 3.13±1.25 <0.01*

Values are presented as mean±standard deviation, number (%), or median (interquartile range).

* p-value <0.05.

GOLD: Global Initiative for Chronic Obstructive Lung Disease; BMI: body mass index; CAT: COPD assessment test; Post-BD: post-bronchodilator, parameters measured after 400 μg inhalation of salbutamol; FEV1: forced expiratory volume 1 second; FVC: forced vital capacity; MMEF: maximal mid-expiratory flow; sRaw: specific airway resistance; TLC: total lung capacity; RV/TLC: ratio of residual volume to total lung capacity; DLCOc: hemoglobin adjusted diffusing capacity of the lungs for carbon monoxide; kCo: diffusion coefficient for carbon monoxide; R5: respiratory system resistance at 5 Hz; ULN: upper limit of normal; X5: respiratory system reactance at 5 Hz; LLN: lower limit of normal; ΔX5: difference in inspiratory and expiratory reactance at 5 Hz; R19: respiratory system resistance at 19 Hz; R5-19: difference in whole-breath resistance at 5 and 19 Hz; SAD: small airway dysfunction; EFLT: expiratory flow limitation at tidal breath; 6MWD: 6-minute walk distance; 6MWT: 6-minute walk test.

Table 2.
Comparison of demographic and lung function parameters according to the GOLD classification
Variable GOLD group A (n=37) GOLD group B (n=107) GOLD group E (n=52) p-value
Age, yr 61.9±8.5 62.8±7.6 65.1±9.8 0.16
Post-BD FEV1, % of predicted 65.22±23.2 55.72±19.7 51.39±17.1 <0.01*
Post-BD FEV1/FVC 57.1±10.3 54.2±9.9 49.6±10.0 <0.01*
Post-BD MMEF, % predicted 48.9±26.5 37.8±19.6 31.5±13.8 <0.01*
Post-BD MMEF <65% of predicted 27 (72.9) 95 (88.8) 50 (96.2) <0.01*
Post-BD sRaw, kPa/sec 2.04±2.11 2.89±2.53 3.05±1.97 0.09
Post-BD TLC, L 5.5±0.9 5.55±1.1 5.71±1.2 0.57
Post-BD RV/TLC, % of predicted 133.7±34.2 150.8±26.5 153.6±29.9 <0.01*
DLCOc, mmol/min/kPa 5.61±1.21 5.19±1.57 4.6±1.65 <0.01*
Post-BD R5, cm H2O/L/sec 4.52±1.81 5.22±1.65 5.34±1.77 0.06
Post-BD R5 >ULN 12 (32.4) 57 (53.3) 29 (55.8) 0.06
Post-BD X5, cm H2O/L/sec -2.44±2.0 -3.29±2.17 -3.73±2.70 0.03*
Post-BD X5 <LLN 14 (37.8) 68 (63.6) 36 (69.2) <0.01*
Post-BD ∆X5 1.38±2.20 2.12±2.44 2.51±2.96 0.12
Post-BD EFLT 8 (21.6) 32 (29.9) 15 (28.8) 0.62
Post-BD R19, cm H2O/L/sec 3.46±1.05 3.68±1.04 3.60±1.04 0.54
Post-BD R19 >ULN 11 (29.7) 44 (41.5) 20 (38.5) 0.45
Post-BD R5-19, cm H2O/L/sec 0.69±0.85 1.29±0.97 1.43±0.99 <0.01*
Post-BD R5-19 >ULN 10 (27.0) 56 (52.3) 30 (57.7) 0.01*
Post-BD SAD 15 (40.5) 71 (66.4) 37 (71.2) <0.01*
6MWD, m 405.8±61.2 371.4±69.8 374.2±69.1 0.01*
Desaturation during 6MWT, % 4.1±4 4.2±4.1 5.2±4.4 0.276

Values are presented as mean±standard deviation or number (%).

* p-value <0.05.

GOLD: Global Initiative for Chronic Obstructive Lung Disease; Post-BD: post-bronchodilator, parameters measured after 400 μg inhalation of salbutamol; FEV1: forced expiratory volume 1 second; FVC: forced vital capacity; MMEF: maximal mid-expiratory flow; sRaw: specific airway resistance; TLC: total lung capacity; RV/TLC: ratio of residual volume to total lung capacity; DLCOc: hemoglobin adjusted diffusing capacity of the lungs for carbon monoxide; R5: respiratory system resistance at 5 Hz; ULN: upper limit of normal; X5: respiratory system reactance at 5 Hz; LLN: lower limit of normal; ΔX5: difference in inspiratory and expiratory reactance at 5 Hz; EFLT: expiratory flow limitation at tidal breath; R19: respiratory system resistance at 19 Hz; R5-19: difference in whole-breath resistance at 5 and 19 Hz; SAD: small airway dysfunction; 6MWD: 6-minute walk distance; 6MWT: 6-minute walk test.

Table 3.
Comparison of COPD patients with and without small airway dysfunction
Characteristic COPD without SAD (n=73) COPD with SAD (n=123) p-value
Age, yr 63.7±8 63.0±8.7 0.59
BMI, kg/m2 22.9±3.9 22.3±5.3 0.38
Smoker 60 (82.2) 108 (87.8) 0.24
CAT score 12.8±6.6 15.5±5.6 <0.01*
GOLD group A 22 (30.1) 15 (12.2) <0.01*
GOLD group B 36 (49.3) 71 (57.7) <0.01*
GOLD group E 15 (20.5) 37 (30.1) <0.01*
Post-BD FEV1, % of the predicted 72.8±17.8 46.6±14.5 <0.01*
Post-BD MMEF <65% of predicted 53 (72.6) 119 (96.7) <0.01*
Post-BD sRaw, kPa/sec 1.49±1.35 3.53±2.46 <0.01*
Post-BD TLC, L 5.55±0.92 5.60±1.13 0.74
Post-BD RV/TLC, % of predicted 129±24 159.7±26.8 <0.01*
DLCOc, mmol/min/kPa 5.63±1.54 4.8±1.50 <0.01*
Post-BD R5, cm H2O/L/sec 3.75±1.15 5.93±1.49 <0.01*
6MWD, m 390.3±57.4 367.5±74.4 0.02*
Desaturation during 6MWT, % 3.2±4.2 5.2±3.9 <0.01*
Change in the Borg score after 6MWT 1.97±1.74 2.63±1.72 0.01*

Values are presented as mean±standard deviation or number (%).

* p-value <0.05.

COPD: chronic obstructive pulmonary disease; SAD: small airway dysfunction; BMI: body mass index; CAT: COPD assessment test; GOLD: Global Initiative for Chronic Obstructive Lung Disease; Post-BD: post-bronchodilator, parameters measured after 400 μg inhalation of salbutamol; FEV1: forced expiratory volume 1 second; MMEF: maximal mid-expiratory flow; sRaw: specific airway resistance; TLC: total lung capacity; RV/TLC: ratio of residual volume to total lung capacity; DLCOc: hemoglobin adjusted diffusing capacity of the lungs for carbon monoxide; R5: respiratory system resistance at 5 Hz; 6MWD: 6-minute walk distance; 6MWT: 6-minute walk test.

Table 4.
Comparison of COPD patients with oscillometric small airway dysfunction with and without EFLT
Characteristic SAD without EFLT (n=68) SAD with EFLT (n=55) p-value
Age, yr 63.1±7.5 62.9±10.1 0.9
BMI, kg/m2 21.9±5.4 22.7±5.3 0.44
CAT score 15.6±5.3 15.3±5.9 0.76
Post-BD FEV1, % of the predicted 50.9±15 41.3±11.9 <0.01*
Post-BD sRaw, kPa/sec 2.75±1.54 4.51±3.01 <0.01*
Post-BD RV/TLC, % predicted 153.1±22.8 167.9±29.2 <0.01*
Post-BD TLC 5.76±1.06 5.41±1.18 0.08
DLCOc, mmol/min/kPa 4.83±1.60 4.76±1.45 0.79
Post-BD R5, cm H2O/L/sec 5.27±1.30 6.75±.29 <0.01*
Post-BD X5, cm H2O/L/sec -3.02±0.92 -6.16±2.01 <0.01*
Post-BD R5-19, cm H2O/L/sec 1.48±0.75 2.08±0.82 <0.01*
Post-BD R19, cm H2O/L/sec 3.44±1.02 4.27±0.92 <0.01*
6MWD, m 372.7±75.3 361±73.5 0.39
Desaturation during 6MWT, % 4.65±3.6 5.8±4.4 0.11
Change in the Borg score after 6MWT 2.32±1.75 3.0±1.62 0.03*

Values are presented as mean±standard deviation.

* p-value <0.05.

EFLT: expiratory flow limitation at tidal breath; COPD: chronic obstructive pulmonary disease; BMI: body mass index; CAT: COPD assessment test; Post-BD: post-bronchodilator, parameters measured after 400 μg inhalation of salbutamol; FEV1: forced expiratory volume 1 second; sRaw: specific airway resistance; RV/TLC: ratio of residual volume to total lung capacity; TLC: total lung capacity; DLCOc: hemoglobin adjusted diffusing capacity of the lungs for carbon monoxide; R5: respiratory system resistance at 5 Hz; X5: respiratory system reactance at 5 Hz; R5-19: difference in whole-breath resistance at 5 and 19 Hz; R19: respiratory system resistance at 19 Hz; 6MWD: 6-min walk distance; 6MWT: 6-min walk test.

Table 5.
Changes in lung function and impedance parameters (post-bronchodilator) during follow-up visits
Variable Baseline visit Follow-up visit p-value
Post-BD FEV1, L 1.24±0.49 1.31±0.54 0.07
Post-BD FVC, L 2.33±0.60 2.32±0.62 0.88
RV/TLC, % predicted 148.7±29.6 145.1±36.5 0.35
DLCOc, % predicted 5.27±1.65 4.97±1.42 0.07
Post-BD R5 5±1.68 4.58±1.76 0.02*
Post-BD X5 -2.88±1.60 -2.80±1.84 0.74
Post-BD ∆X5 1.51±1.48 1.57±1.85 0.79
Post-BD R5-19 1.08±0.83 1.11±0.82 0.79
Post-BD R19 3.52±1.13 3.19±1.08 0.05*
CAT score 13.1±5.2 11.3±5.0 0.05*
6MWD, m 384.1±72.6 377.2±64.2 0.38

Values are presented as mean±standard deviation.

* p-value <0.05.

Post-BD: post-bronchodilator; FEV1: forced expiratory volume 1 second; FVC: forced vital capacity; RV/TLC: ratio of residual volume to total lung capacity; DLCOc: hemoglobin adjusted diffusing capacity of the lungs for carbon monoxide; R5: respiratory system resistance at 5 Hz; X5: respiratory system reactance at 5 Hz; ΔX5: difference in inspiratory and expiratory reactance at 5 Hz; R5-19: difference in whole-breath resistance at 5 and 19 Hz; R19: respiratory system resistance at 19 Hz; CAT: COPD assessment test; 6MWD: 6-minute walk distance.

REFERENCES

1. Global Initiative for Chronic Obstructive Lung Disease. Global Initiative for Chronic Obstructive Lung Disease 2023 report: global strategy for the diagnosis, management, and prevention of chronic obstructive pulmonary disease [Internet]. Fontana: GOLD; 2024 [cited 2024 Jan 2]. Available from: https://goldcopd.org/wp-content/uploads/2022/12/GOLD-2023-ver-1.1-2Dec2022_WMV.pdf.

2. McNulty W, Usmani OS. Techniques of assessing small airways dysfunction. Eur Clin Respir J 2014;1:25898.
crossref pmid pmc
3. Higham A, Quinn AM, Cancado JED, Singh D. The pathology of small airways disease in COPD: historical aspects and future directions. Respir Res 2019;20:49.
crossref pmid pmc pdf
4. Chiu HY, Hsiao YH, Su KC, Lee YC, Ko HK, Perng DW. Small airway dysfunction by impulse oscillometry in symptomatic patients with preserved pulmonary function. J Allergy Clin Immunol Pract 2020;8:229-35.
crossref pmid
5. Singh D. Small airway disease in patients with chronic obstructive pulmonary disease. Tuberc Respir Dis (Seoul) 2017;80:317-24.
crossref pmid pmc pdf
6. King GG, Bates J, Berger KI, Calverley P, de Melo PL, Dellaca RL, et al. Technical standards for respiratory oscillometry. Eur Respir J 2020;55:1900753.
crossref pmid
7. De S, Banerjee N, Kushwah GDS, Dharwey D. Regression equations of respiratory impedance of Indian adults measured by forced oscillation technique. Lung India 2020;37:30-6.
crossref pmid pmc
8. Aarli BB, Calverley PM, Jensen RL, Eagan TM, Bakke PS, Hardie JA. Variability of within-breath reactance in COPD patients and its association with dyspnoea. Eur Respir J 2015;45:625-34.
crossref pmid
9. Graham BL, Steenbruggen I, Miller MR, Barjaktarevic IZ, Cooper BG, Hall GL, et al. Standardization of spirometry 2019 update: an official American Thoracic Society and European Respiratory Society technical statement. Am J Respir Crit Care Med 2019;200:e70-88.
crossref pmid pmc
10. Chhabra SK, Kumar R, Gupta U, Rahman M, Dash DJ. Prediction equations for spirometry in adults from northern India. Indian J Chest Dis Allied Sci 2014;56:221-9.
crossref pmid
11. Quanjer PH, Stanojevic S, Cole TJ, Baur X, Hall GL, Culver BH, et al. Multi-ethnic reference values for spirometry for the 3-95-yr age range: the global lung function 2012 equations. Eur Respir J 2012;40:1324-43.
crossref pmid pmc
12. ATS Committee on Proficiency Standards for Clinical Pulmonary Function Laboratories. ATS statement: guidelines for the six-minute walk test. Am J Respir Crit Care Med 2002;166:111-7.
crossref pmid
13. McDonough JE, Yuan R, Suzuki M, Seyednejad N, Elliott WM, Sanchez PG, et al. Small-airway obstruction and emphysema in chronic obstructive pulmonary disease. N Engl J Med 2011;365:1567-75.
crossref pmid pmc
14. Janson C, Malinovschi A, Amaral AFS, Accordini S, Bousquet J, Buist AS, et al. Bronchodilator reversibility in asthma and COPD: findings from three large population studies. Eur Respir J 2019;54:1900561.
crossref pmid
15. Pisi R, Aiello M, Zanini A, Tzani P, Paleari D, Marangio E, et al. Small airway dysfunction and flow and volume bronchodilator responsiveness in patients with chronic obstructive pulmonary disease. Int J Chron Obstruct Pulmon Dis 2015;10:1191-7.
pmid pmc
16. Crisafulli E, Pisi R, Aiello M, Vigna M, Tzani P, Torres A, et al. Prevalence of small-airway dysfunction among COPD patients with different GOLD stages and its role in the impact of disease. Respiration 2017;93:32-41.
crossref pmid pdf
17. Crim C, Celli B, Edwards LD, Wouters E, Coxson HO, Tal-Singer R, et al. Respiratory system impedance with impulse oscillometry in healthy and COPD subjects: ECLIPSE baseline results. Respir Med 2011;105:1069-78.
crossref pmid
18. Lu L, Peng J, Wu F, Yang H, Zheng Y, Deng Z, et al. Clinical characteristics of airway impairment assessed by impulse oscillometry in patients with chronic obstructive pulmonary disease: findings from the ECOPD study in China. BMC Pulm Med 2023;23:52.
crossref pmid pmc pdf
19. Mikamo M, Shirai T, Mori K, Shishido Y, Akita T, Morita S, et al. Predictors of expiratory flow limitation measured by forced oscillation technique in COPD. BMC Pulm Med 2014;14:23.
crossref pmid pmc pdf
20. Paredi P, Goldman M, Alamen A, Ausin P, Usmani OS, Pride NB, et al. Comparison of inspiratory and expiratory resistance and reactance in patients with asthma and chronic obstructive pulmonary disease. Thorax 2010;65:263-7.
crossref pmid
21. Beech A, Jackson N, Dean J, Singh D. Expiratory flow limitation in a cohort of highly symptomatic COPD patients. ERJ Open Res 2022;8:00680-2021.
crossref pmid pmc
22. Dean J, Kolsum U, Hitchen P, Gupta V, Singh D. Clinical characteristics of COPD patients with tidal expiratory flow limitation. Int J Chron Obstruct Pulmon Dis 2017;12:1503-6.
crossref pmid pmc pdf
23. Aarli BB, Calverley PM, Jensen RL, Dellaca R, Eagan TM, Bakke PS, et al. The association of tidal EFL with exercise performance, exacerbations, and death in COPD. Int J Chron Obstruct Pulmon Dis 2017;12:2179-88.
crossref pmid pmc pdf
24. Anderson WJ, Lipworth BJ. Relationships between impulse oscillometry, spirometry and dyspnoea in COPD. J R Coll Physicians Edinb 2012;42:111-5.
crossref pmid


ABOUT
ARTICLE & TOPICS
Article category

Browse all articles >

Topics

Browse all articles >

BROWSE ARTICLES
FOR CONTRIBUTORS
Editorial Office
101-605, 58, Banpo-daero, Seocho-gu (Seocho-dong, Seocho Art-Xi), Seoul 06652, Korea
Tel: +82-2-575-3825, +82-2-576-5347    Fax: +82-2-572-6683    E-mail: katrdsubmit@lungkorea.org                

Copyright © 2024 by The Korean Academy of Tuberculosis and Respiratory Diseases. All rights reserved.

Developed in M2PI

Close layer
prev next