Tuberc Respir Dis > Volume 86(4); 2023 > Article
Choi, Park, Cho, and Byun: Low Skeletal Muscle Mass and Clinical Outcomes in Chronic Obstructive Pulmonary Disease

Abstract

Background

In patients with chronic obstructive pulmonary disease (COPD), decreased muscle mass is a frequently encountered comorbidity in clinical practice. However, the evaluation of muscle mass in patients with COPD in real-world practice is rare.

Methods

We retrospectively reviewed the electronic medical records of all patients with COPD who underwent bioelectrical impedance analysis at least once between January 2011 and December 2021 in three hospitals. Then, we analyzed the performance rate of muscle mass measurement in the patients and the correlation between muscle mass, clinical parameters, and COPD prognosis.

Results

Among the 24,502 patients with COPD, only 270 (1.1%) underwent muscle mass measurements. The total skeletal muscle mass index was significantly correlated with albumin, alanine transaminase, and creatinine to cystatin C ratio in patients with COPD (r=0.1614, p=0.011; r=0.2112, p=0.001; and r=0.3671, p=0.001, respectively). Acute exacerbation of COPD (AE COPD) was significantly correlated with muscle mass, especially the truncal skeletal muscle mass index (TSMI) in males (r=-0.196, p=0.007). In the multivariate analysis, TSMI and cystatin C were significant risk factors for AE COPD (hazard ratio, 0.200 [95% confidence interval, CI, 0.048 to 0.838] and 4.990 [95% CI, 1.070 to 23.278], respectively).

Conclusion

Low muscle mass negatively affects the clinical outcomes in patients with COPD. Despite its clinical significance, muscle mass measurement is performed in a small proportion of patients with COPD. Therefore, protocols and guidelines for the screening of sarcopenia in patients with COPD should be established.

Introduction

Sarcopenia is defined sarcopenia as age-related loss of muscle mass with low muscle strength, and/or low physical performance [1]. The Asian Working Group for Sarcopenia 2019 guidelines provide definitions for low muscle mass and low muscle strength. Low muscle mass is defined as a muscle mass index of less than 7.0 kg/m2 in men and less than 5.7 kg/m2 in women, as measured by bioimpedance. Low muscle strength is defined as hand grip strength values less than 27 kg in men and less than 16 kg in women.
Sarcopenia is commonly accompanied by chronic obstructive pulmonary disease (COPD) in 8% to 21% of cases [2]. COPD leads to decreased muscle mass, especially in patients with moderate-to-severe COPD or acute exacerbation COPD (AE COPD) [3-6]. Under mutual influence, decreased muscle mass leads to worsened clinical outcomes, forced expiratory volume in 1 second (FEV1), exercise capacity, and quality of life in patients with COPD [7]. In our previous study, sarcopenia was found to be significantly associated with inflammation and poor prognosis, such as acute exacerbation [8]. However, previous study had limitations such as a small sample size and a cross-sectional study design. Nevertheless, the findings suggest that regular evaluation of nutritional status and physical condition is important for patients with COPD. Therefore, further studies are needed that include a larger number of patients. Recently, the importance of muscle mass evaluation in COPD has been highlighted; however, it remains underestimated in real-world clinical settings. Screening for high-risk patients with sarcopenia is also uncommon. In addition, data on indication, method, and interval of muscle mass measurement in patients with COPD are still insufficient.
This retrospective multi-center cohort study aimed to confirm the current status of muscle mass measurement in patients with COPD and verify the correlation between muscle mass, clinical parameters, and COPD prognosis.

Materials and Methods

1. Study design and patients

We retrospectively reviewed the electronic medical records (EMR) of all patients with COPD who visited the following three hospitals between January 2011 and December 2021: Severance Hospital, Gangnam Severance Hospital, and Yongin Severance Hospital in South Korea (Figure 1). COPD patients are defined by the International Classification of Diseases 10th Revision (ICD-10) diagnostic codes for COPD or emphysema (J43.0x-J44.x, excluding J43.0) and the prescription of COPD medications, which include muscarinic antagonists, beta-2 agonists, inhaled corticosteroids, phosphodiesterase-4 inhibitors, and methylxanthines. Among COPD patients, we included all patients those who underwent bioelectrical impedance analysis (BIA) at least once during this period to evaluate muscle mass. We excluded patients who visited an outpatient clinic only once or those with an active lung disease, bronchial asthma (asthma-COPD overlap syndrome), lung resection, or transplantation. We also excluded patients who had missing laboratory data within the last 6 months.

2. Measurement of muscle mass and strength

Muscle mass was quantified using BIA. The fat mass index (FMI) and fat free mass index (FFMI) were calculated as the fat mass and fat free mass (FFM), respectively, divided by the square of the patient’s height (kg/height2). The skeletal muscle mass index (SMI) was calculated as the skeletal muscle mass (SMM) divided by the square of the patient’s height (kg/height2). The appendicular skeletal muscle mass index (ASMI) and truncal skeletal muscle mass index (TSMI) reflected the muscle mass of the limbs and trunk, respectively.

3. Data collection

The demographic characteristics included age, sex, height (cm), weight (kg), body mass index (BMI; kg/m2), and waist-to-hip ratio. Comorbidities were evaluated using Charlson comorbidity index (CCI) and classified as follows by using the algorithm of Quan et al. [9] History of osteoporosis was evaluated by ICD-10 (M80-82). Laboratory data were obtained, including protein, albumin, aspartate aminotransferase (AST), alanine transaminase (ALT), total bilirubin, blood urea nitrogen (BUN), creatinine, cystatin C, and C-reactive protein (CRP) levels. Because these laboratory values were influenced by the acute conditions of the patients, we defined the median value of these laboratory data over a year as the baseline.

4. Clinical outcomes

Clinical outcomes included AE COPD, pneumonia development, outpatient/emergency room (ER) visits, and admissions to the general ward or intensive care unit for a year after muscle mass measurement. Cases of all-cause in-hospital mortality were evaluated for the entire study period. AE COPD was defined with worsening of clinical symptoms and use of systemic steroid. Pneumonia was diagnosed by clinical symptoms and radiologic findings. The evaluation of events per year was based on recorded events in the EMR during a 1-year period after the visit for the BIA test. The follow-up period utilized in the Cox regression analysis was defined as the duration from the date of the visit for the BIA test up to the last follow-up.

5. Ethics

This study was approved by the Institutional Review Board of Gangnam Severance Hospital (number: 3-2022-0417). Data were collected in accordance with the Declaration of Helsinki. All data for the retrospective analysis of clinical outcomes were fully anonymized before access, and the ethics committee waived the requirement for written informed consent because of the retrospective nature of this study.

6. Statistical analysis

Between-group comparisons of categorical variables were performed using the Chi-squared test or Fisher’s exact test. Based on the Shapiro-Wilk test, parametric and non-parametric continuous variables were compared using an independent two-sample t-test and Kruskal-Wallis rank sum test, respectively. Correlations between variables were analyzed using Pearson’s correlation analysis. Hazard ratios for AE COPD were analyzed using the Cox regression model. Statistical significance was set at p<0.05. Statistical analyses were conducted using the R software version 4.0.2 (R Foundation for Statistical Computing, Vienna, Austria). Pearson’s correlation analysis was performed using the “stats” package in R. Cox regression analysis was performed using the “survival” package in R.

Results

1. Baseline characteristics

Among 24,502 patients with COPD, only 270 (1.1%) underwent BIA for the measurement of muscle mass, and 253 patients were finally included in the analysis (Figure 1). The most common purpose for conducting BIA was rehabilitation with 132 patients (52.2%), followed by sarcopenia screening with 79 patients (31.2%) (Table 1). There were no significant sex-related differences in age, BMI, waist-to-hip ratio, CCI score, and comorbidities, except in dementia (male vs. female: 15.3% vs. 29.7%, p=0.019). FFMI, and SMI were higher in males than in females (male vs. female; mean±standard deviation or median [interquartile range]: 17.0±2.0 kg/m2 vs. 14.9±1.9 kg/m2, p<0.001; and 14.7 kg/m2 [13.6 to 15.9] vs. 12.5 kg/m2 [10.8 to 13.2], p<0.001; respectively). The FMI was higher in females than in males (male vs. female: 5.8 kg/m2 [4.2 to 7.5] vs. 7.0 kg/m2 [5.1 to 10.2], p=0.002). In the baseline laboratory data, there were no significant sex-related differences in serum protein, albumin, AST, cystatin C, or CRP levels (Table 1). On the contrary, ALT, total bilirubin, BUN, and creatinine were higher in males than in females (Table 1). Creatinine to cystatin C ratio was significantly higher in males than in females (0.7±0.2 vs. 0.6±0.2, p=0.047).

2. Low muscle mass and clinical outcomes in patients with COPD

We obtained tertiles of ASMI in each male and female patient and divided them into three groups (Table 2). The first tertile (T1, 33rd percentile) and second tertile (T2, 66th percentile) were 6.727 and 7.407 kg/m2 in males and 5.269 and 6.027 kg/m2 in females, respectively. All-cause in-hospital mortality and ER visits within 1 year were significantly higher in patients with lower muscle mass (T1 group vs. T2 group vs. T3 group; 14.3% vs. 12.0% vs. 1.2%, p=0.006; and 10.7% vs. 3.6% vs. 2.3%, p=0.037; respectively). Specifically, male COPD patients with an ASMI lower than 6.727 kg/m2 have a higher prevalence of all-cause in-hospital mortality and ER visits within 1 year compared to male COPD patients with an ASMI higher than 7.407 kg/m2 (14.3% vs. 1.6%, p=0.007; and 14.3% vs. 3.1%, p=0.025; respectively). Although not significant, AE COPD and admission within 1 year were also higher in the lower muscle mass group (Table 2).

3. Laboratory parameters associated with muscle mass in patients with COPD

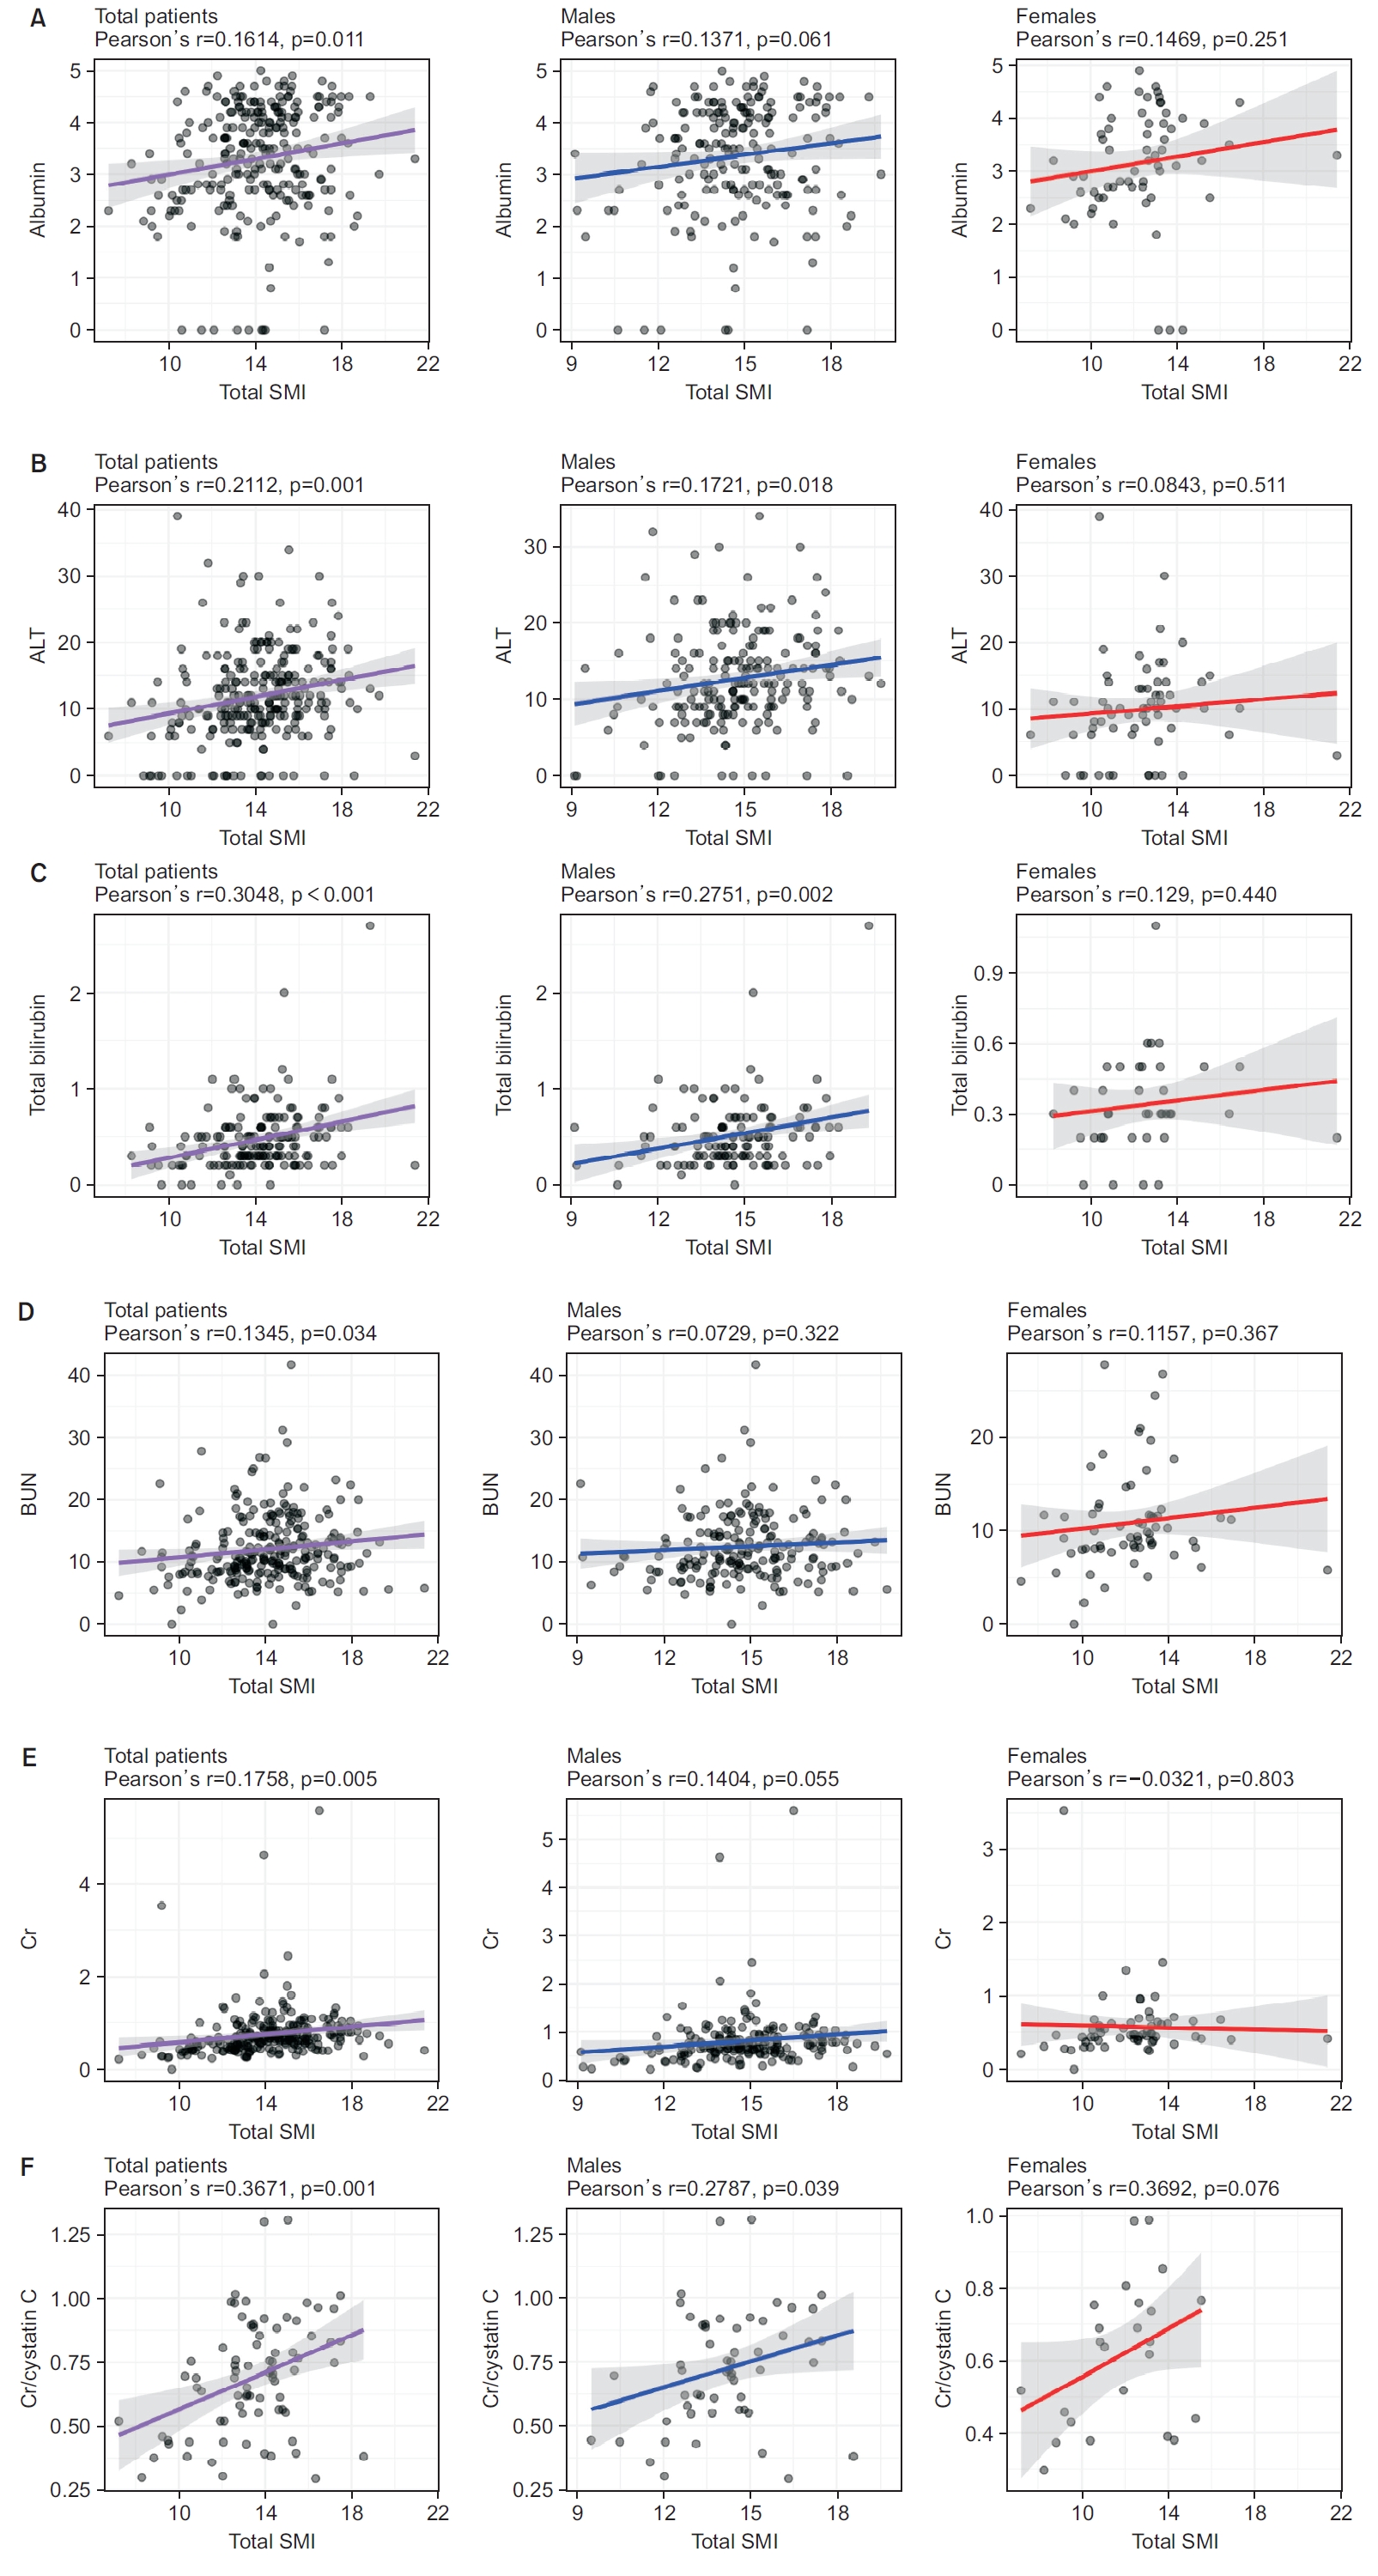
Total SMI was significantly correlated with albumin, ALT, total bilirubin, BUN, creatinine, and creatinine/cystatin C levels in all patients (correlation coefficient [r]=0.1614, r=0.2112, r=0.3048, r=0.1345, r=0.1758, and r=0.3671, respectively) (Figure 2 and Supplementary Table S1). In males, ALT, total bilirubin, and creatinine/cystatin C levels were significantly correlated with total SMI (r=0.1721, r=0.2751, and r=0.2787; respectively). Conversely, no parameters were significantly related to total SMI in females (Supplementary Table S1). Although no significant difference was observed in females, in both total patients and males, creatinine/cystatin C was the most highly correlated with total SMI (r=0.3671 and r=0.2787, respectively) (Figure 2).

4. Muscle mass, laboratory parameters, and clinical outcomes in patients with COPD

The AE COPD frequency was significantly correlated with muscle mass (r=-0.127) (Table 3). TSMI was significantly associated with AE COPD in all male patients (r=-0.196). Total SMI and ASMI were significantly associated with AE COPD in male patients (r=-0.198 and r=-0.172, respectively). The frequency of pneumonia was not significantly correlated with either muscle mass or laboratory parameters (Table 3). ER visit frequency was correlated with comorbidities (CCI score) and albumin level in all patients (r=0.168 and r=-0.143, respectively). In male patients, CCI score, total SMI, TSMI, and serum albumin level were correlated with ER visit frequency (r=0.214, r=-0.178, r=-0.191, and r=-0.175, respectively). Admission frequency was correlated with CCI score, total SMI, ASMI, albumin, and creatinine in all patients (r=0.135, r=-0.132, r=-0.138, r=-0.143, and r=0.342, respectively). In males, CCI score and albumin and creatinine levels were correlated with admission frequency (r=0.157, r=-0.184, and r=0.275, respectively). Creatinine/cystatin C was not significantly associated with the frequency of exacerbation, pneumonia, ER visits, or admission in patients with COPD (Table 3).

5. Muscle mass index as a risk factor for AE COPD

In Cox regression, low TSMI was a significant risk factor for AE COPD in both univariate and multivariate analyses (hazard ratio [95% confidence interval]: 0.615 [0.385 to 0.982], p=0.042; and 0.200 [0.048 to 0.838], p=0.028; respectively) (Table 4). A high cystatin C level was also a significant risk factor for AE COPD in both univariate and multivariate analyses (3.375 [1.372 to 8.299], p=0.008; and 4.990 [1.070 to 23.278], p=0.031; respectively). Among the demographic variables, male sex was a significant risk factor for AE COPD in the multivariate analysis (17.304 [1.127 to 265.786], p=0.041).

Discussion

Our study revealed that only approximately 1.1% of all COPD patients underwent muscle mass evaluation, and among those patients, only 31.2% underwent BIA for sarcopenia screening. This highlights the lack of effort for sarcopenia screening and diagnosis in the real-world clinical setting of COPD. Currently, there are no clear guidelines regarding which COPD patients should be performed muscle mass evaluation for sarcopenia screening, which modality should be used, and what treatments are necessary for sarcopenia patients. This study emphasizes the need for a related working group and guidelines for clinicians.
As per our findings, low muscle mass was associated with all-cause mortality, exacerbation frequency, ER visit frequency, and admission frequency in patients with COPD. Low muscle mass was also correlated with clinical parameters such as serum albumin level, ALT, total bilirubin, BUN, creatinine, and creatinine/cystatin C. However, unlike muscle mass, these parameters did not reflect the prognosis of COPD. Only albumin was associated with ER visits and admissions in the correlation analysis, and cystatin C levels were associated with AE COPD in the Cox regression analysis.
These findings demonstrate the necessity of evaluating muscle mass and recommending nutritional supplementation and exercise for patients with COPD. The main muscle mass parameter for the diagnosis of sarcopenia in the general population is ASMI [2,10-12]. Appendicular muscle is important for movement and exercise. In terms of respiratory muscles, TSMI may be more crucial than ASMI in patients with COPD. In the current study, TSMI was significantly associated with AE COPD compared with total SMI or ASMI in both Pearson’s correlation analysis and Cox regression analysis. Therefore, TSMI may be a better parameter than ASMI for evaluating muscle mass in patients with COPD. Further research is needed regarding this matter. To reflect the clinical course of COPD, it is necessary to establish specialized screening criteria for sarcopenia in the patients by supplementing the existing sarcopenia diagnostic criteria. Therefore, long-term, large-scale research is required.
To establish screening criteria for sarcopenia in COPD patients, it is important to study the relationship between muscle mass and clinical parameters. Albumin level is one of parameters that has been associated with muscle mass. Baumgartner et al. [13] reported that serum albumin level was associated with muscle mass after adjusting for age, protein intake, physical activity, and comorbidity in men and women. However, since the albumin level in patients with COPD is lower than that in the non-COPD population, the association between albumin and muscle mass in these patients may be different from that in the general population [14]. The current study found a significant association between albumin and muscle mass, even among patients with COPD. And consistent with previous research, low albumin levels were linked to poor prognosis in COPD patients in this study [15,16]. Therefore, evaluating serum albumin levels in patients with COPD is useful for predicting prognosis.
Serum ALT levels also positively correlated with muscle mass in the current study. Several previous studies have reported an association between ALT level and muscle mass [17-19]. ALT level is commonly used to evaluate hepatic dysfunction; however, it can reflect SMM, as it is also distributed in the heart, muscles, and kidneys [20]. In addition, several studies have reported that low ALT levels are associated with COPD development, acute exacerbations, and mortality [20,21]. However, the current study did not show a significant association between ALT levels and COPD prognosis. The small number of patients and follow-up duration may have affected the results.
Cystatin C has been used as a simple, accurate, and rapid endogenous marker of the glomerular filtration rate [22]. Creatinine is generated in proportion to muscle mass; however, cystatin C levels are not affected by it [23]. Therefore, the serum creatinine to cystatin C ratio can be used to evaluate muscle mass in several diseases [24-26]. Similar to the results of the previous study, this study also showed a significant correlation between the serum creatinine to cystatin C ratio and muscle mass in patients with COPD [27]. However, this study did not show a meaningful correlation between the serum creatinine to cystatin C ratio and clinical outcomes. Cystatin C was an independent risk factor for AE COPD. Chai et al. [28] also reported that serum cystatin C levels were higher in patients with COPD than in controls and in patients with AE COPD than in those with stable COPD. In addition, serum cystatin C levels are negatively correlated with FEV1 or forced vital capacity [28]. These results suggest the roles of cystatin C in COPD development and progression. Further large-scale well-designed studies are required.
The strengths of our study are as follows. First, because the study was conducted as a multi-center observational cohort study, it included a relatively large number of patients compared to that in previous studies. Second, we defined the median value among the 1-year laboratory data for each patient as the baseline; therefore, it better reflected the patient’s chronic condition. Lastly, to the best of our knowledge, this is the first study to address low muscle mass on clinical outcomes of Korean patients with COPD.
This study also had some limitations. First, the data were obtained through a retrospective review of EMR, which could have resulted in biases. There is the possibility of omitted confounding factors that could potentially influence the results, as well as selection bias or missed patients/events during the study period. Notably, as COPD exacerbations occurred in only 5.1% of all patients within 1 year, this small number of events could have an impact on the analysis results. Secondly, as a non-protocolized retrospective multi-center study, the equipment used for BIA measurements was not consistent, which may have had an impact on the results. Furthermore, BIA measurements can be influenced by BMI and sex, which may result in an overestimation of FFM when compared to dual-energy X-ray absorptiometry. These technical characteristics of BIA should be carefully considered when interpreting the study’s findings. Thirdly, since patients with COPD were included for a long period of 11 years, it is possible that changes in the treatment guidelines might have affected the results. Finally, we were unable to completely exclude patients who had factors that could influence BIA measurements, such as obesity and osteoporosis. This may have affected the results. However, we attempted to minimize these effects by conducting multivariate analysis that included BMI and the presence of osteoporosis.
In conclusion, low muscle mass negatively affects clinical outcomes in patients with COPD. Despite its clinical significance, muscle mass measurement is performed in a small proportion of these patients. Therefore, protocols and guidelines for screening for sarcopenia in patients with COPD should be established.

Notes

Authors’ Contributions

Conceptualization: Choi YJ, Byun MK. Methodology: Park HJ, Cho JH. Formal analysis: Choi YJ, Park HJ, Cho JH, Byun MK. Data curation: Park HJ, Cho JH. Writing - original draft preparation: Choi YJ, Park HJ, Cho JH, Byun MK. Writing - review and editing: Choi YJ, Park HJ, Cho JH, Byun MK. Approval of final manuscript: all authors.

Conflicts of Interest

No potential conflict of interest relevant to this article was reported.

Funding

No funding to declare.

Supplementary Material

Supplementary material can be found in the journal homepage (http://www.e-trd.org).
Supplementary Table S1.
Correlation between laboratory parameters and skeletal muscle mass index.
trd-2023-0008-Supplementary-Table-S1.pdf

Fig. 1.
Study flow. COPD: chronic obstructive pulmonary disease.
trd-2023-0008f1.jpg
Fig. 2.
Pearson’s correlation plot between laboratory parameters and muscle mass. (A) Association of albumin levels with total skeletal muscle mass index (SMI). (B) Association of alanine aminotransferase (ALT) levels with total SMI. (C) Association of total bilirubin levels with total SMI. (D) Association of blood urea nitrogen (BUN) levels with total SMI. (E) Association of creatinine (Cr) levels with total SMI. (F) Association of Cr to cystatin C ratio with total SMI.
trd-2023-0008f2.jpg
Table 1.
Baseline characteristics
Group Total (n=253) Male (n=189) Female (n=64) p-value
Age, yr 71.0 (64.5-77.1) 71.7 (65.8-77.0) 68.5 (62.9-79.1) 0.321
Height, cm 164.1±7.9 167.1±6.0 155.2±5.9 <0.001*
Weight, kg 61.0 (54.1-68.0) 63.0 (57.8-69.9) 54.2 (44.5-62.2) <0.001*
BMI, kg/m2 22.8 (20.4-25.0) 22.9 (20.8-24.9) 22.4 (19.6-25.4) 0.270
Fat mass index, kg/m2 6.0 (4.5-8.0) 5.8 (4.2-7.5) 7.0 (5.1-10.2) 0.002*
Fat free mass index, kg/m2 16.4±2.2 17.0±2.0 14.9±1.9 <0.001*
SMI, kg/m2 14.2 (12.7-15.5) 14.7 (13.6-15.9) 12.5 (10.8-13.2) <0.001*
TSMI 7.4 (6.7-8.1) 7.6 (7.1-8.3) 6.7 (5.7-7.2) <0.001*
ASMI 6.8 (6.0-7.4) 7.1 (6.5-7.7) 5.7 (4.9-6.1) <0.001*
Waist hip ratio 0.9 (0.9-1.0) 0.9 (0.9-1.0) 0.9 (0.8-1.0) 0.668
Comorbidities
CCI score (points) 4.0 (3.0-7.0) 4.0 (3.0-6.0) 5.0 (3.0-7.5) 0.190
Myocardial infarction 20 (7.9) 17 (9.0) 3 (4.7) 0.403
Congestive heart failure 80 (31.6) 55 (29.1) 25 (39.1) 0.185
Peripheral vascular disease 55 (21.7) 43 (22.8) 12 (18.8) 0.620
Cerebrovascular disease 91 (36.0) 68 (36.0) 23 (35.9) 1.000
Dementia 48 (19.0) 29 (15.3) 19 (29.7) 0.019*
Chronic pulmonary disease 253 (100.0) 189 (100.0) 64 (100.0) 1.000
Rheumatic disease 7 (2.8) 6 (3.2) 1 (1.6) 0.811
Peptic ulcer disease 63 (24.9) 41 (21.7) 22 (34.4) 0.063
Mild liver disease 41 (16.2) 28 (14.8) 13 (20.3) 0.404
DM without chronic complication 99 (39.1) 75 (39.7) 24 (37.5) 0.872
DM with chronic complication 46 (18.2) 36 (19.0) 10 (15.6) 0.670
Hemiplegia or paraplegia 49 (19.4) 34 (18.0) 15 (23.4) 0.441
Renal disease 54 (21.3) 42 (22.2) 12 (18.8) 0.682
Any malignancy* 81 (32.0) 58 (30.7) 23 (35.9) 0.533
Moderate or severe liver disease 2 (0.8) 1 (0.5) 1 (1.6) 1.000
Metastatic solid tumor 16 (6.3) 9 (4.8) 7 (10.9) 0.145
AIDS/HIV 0 0 0 1.000
History of osteoporosis 59 (23.3) 44 (23.3) 15 (23.4) 1.000
Laboratory data
Protein 5.9 (4.9-6.8) 6.0 (5.0-6.9) 5.5 (4.8-6.6) 0.154
Albumin 3.4 (2.7-4.2) 3.5 (2.7-4.2) 3.2 (2.6-3.9) 0.120
Aspartate aminotransferase 17.0 (14.0-22.0) 17.5 (14.0-22.0) 17.0 (13.0-19.0) 0.160
Alanine aminotransferase 11.0 (8.0-15.0) 12.0 (9.0-16.0) 10.0 (6.0-13.0) 0.002*
Total bilirubin 0.4 (0.3-0.6) 0.5 (0.3-0.6) 0.3 (0.2-0.5) 0.002*
Blood urea nitrogen 10.9 (8.5-14.7) 11.5 (8.9-14.8) 9.7 (8.1-11.8) 0.009*
Creatinine 0.7 (0.5-0.9) 0.7 (0.6-0.9) 0.5 (0.4-0.6) <0.001*
Cystatin C 1.2 (0.9-1.5) 1.2 (1.0-1.5) 1.0 (0.9-1.4) 0.201
Creatinine to cystatin C ratio 0.7±0.2 0.7±0.2 0.6±0.2 0.047*
C-reactive protein 1.1 (0.5-2.8) 1.1 (0.5-3.3) 1.2 (0.5-2.2) 0.627
Purpose of a BIA test 0.147
Rehabilitation program 132 (52.2) 98 (51.9) 34 (53.1) 0.860
Sarcopenia screening 79 (31.2) 65 (34.4) 14 (21.9) 0.062
Body fluid evaluation 4 (1.6) 3 (1.6) 1 (1.6) 0.989
Endocrine disorders evaluation 26 (10.3) 15 (7.9) 11 (17.2) 0.035*
Health examination 12 (4.7) 8 (4.2) 4 (6.2) 0.512
History of previous AE COPD 59 (23.3) 44 (23.3) 15 (23.4) 1.000

Values are presented as median (interquartile range), mean±standard deviation, or number (%).

* p<0.05 (including lymphoma and leukemia, except malignant neoplasm of skin).

BMI: body mass index; SMI: skeletal muscle mass index; TSMI: trunk muscle mass index; ASMI: appendicular muscle mass index; CCI: Charlson comorbidity index; DM: diabetes mellitus; AIDS: acquired immunodeficiency syndrome; HIV: human immunodeficiency virus; BIA: bioelectrical impedance analysis; AE: acute exacerbation; COPD: chronic obstructive pulmonary disease.

Table 2.
Comparison of clinical outcomes between the muscle mass tertile groups
Variable 1st tertile 2nd tertile 3rd tertile p-value
Total patients 84 83 86
All-cause in-hospital mortality 12 (14.3) 10 (12.0) 1 (1.2) 0.006*
AE COPD within 1 year 7 (8.3) 2 (2.4) 4 (4.7) 0.216
1 event/yr 2 (2.4) 1 (1.2) 0
2 events/yr 1 (1.2) 1 (1.2) 1 (1.2)
Above 3 events/yr 4 (4.8) 0 3 (3.5)
Pneumonia within 1 year 4 (4.8) 3 (3.6) 2 (2.3) 0.692
1 event/yr 1 (1.2) 1 (1.2) 0
2 events/yr 0 0 1 (1.2)
Above 3 events/yr 3 (3.6) 2 (2.4) 1 (1.2)
ER visits within 1 year 9 (10.7) 3 (3.6) 2 (2.3) 0.037*
1 event/yr 4 (4.8) 2 (2.4) 1 (1.2)
2 events/yr 1 (1.2) 0 0
Above 3 events/yr 4 (4.8) 1 (1.2) 1 (1.2)
Admissions within 1 year 17 (20.2) 10 (12.0) 11 (12.8) 0.259
1 event/yr 5 (6.0) 4 (4.8) 1 (1.2)
2 events/yr 0 1 (1.2) 5 (5.8)
Above 3 events/yr 12 (14.3) 5 (6.0) 5 (5.8)
ICU admissions within 1 year 2 (2.4) 2 (2.4) 1 (1.2) 0.800
Male 63 62 64
All-cause in-hospital mortality 9 (14.3) 8 (12.9) 1 (1.6) 0.027*
AE COPD within 1 year 6 (9.5) 1 (1.6) 4 (6.2) 0.165
Pneumonia within 1 year 4 (6.3) 1 (1.6) 2 (3.1) 0.358
ER visits within 1 year 9 (14.3) 3 (4.8) 2 (3.1) 0.036*
Admissions within 1 year 13 (20.6) 6 (9.7) 9 (14.1) 0.221
ICU admissions within 1 year 2 (3.2) 0 1 (1.6) 0.365
Female 21 21 22
All-cause in-hospital mortality 3 (14.3) 2 (9.5) 0 0.205
AE COPD within 1 year 1 (4.8) 1 (4.8) 0 0.582
Pneumonia within 1 year 0 2 (9.5) 0 0.121
ER visits within 1 year 0 0 0 1.000
Admissions within 1 year 4 (19.0) 4 (19.0) 2 (9.1) 0.581
ICU admissions within 1 year 0 2 (9.5) 0 0.121

Values are presented as number (%).

* p<0.05.

The observation period for the results ranged from 365 to 4,239 days, with a median observation period of 1,223 days.

AE: acute exacerbation; COPD: chronic obstructive pulmonary disease; ER: emergency room; ICU: intensive care unit.

Table 3.
Correlation between clinical outcomes, muscle mass, and laboratory parameters
Variable Exacerbation, /yr
Pneumonia, /yr
ER visit, /yr
Admission, /yr
r p-value r p-value r p-value r p-value
Total patients
Age -0.095 0.132 0.008 0.899 0.043 0.500 0.093 0.140
CCI 0.045 0.474 -0.026 0.681 0.168 0.007* 0.135 0.032*
Total SMI -0.117 0.064 -0.069 0.275 -0.084 0.185 -0.132 0.037*
TSMI -0.127 0.043* -0.064 0.314 -0.106 0.092 -0.111 0.079
ASMI -0.095 0.132 -0.067 0.290 -0.055 0.387 -0.138 0.029*
Albumin -0.114 0.073 -0.100 0.116 -0.143 0.024* -0.143 0.024*
ALT -0.017 0.787 -0.052 0.412 -0.097 0.125 -0.107 0.091
Total bilirubin -0.071 0.374 -0.031 0.694 -0.007 0.926 -0.120 0.129
BUN -0.103 0.104 -0.064 0.312 -0.043 0.501 -0.091 0.150
Creatinine -0.067 0.295 -0.054 0.398 -0.049 0.445 0.342 <0.001*
Cr/Cys C -0.149 0.189 0.077 0.499 -0.115 0.311 -0.085 0.457
Male
Age -0.111 0.130 -0.015 0.843 0.045 0.538 0.029 0.692
CCI 0.070 0.335 -0.082 0.259 0.214 0.003* 0.157 0.031*
Total SMI -0.198 0.006* -0.130 0.074 -0.178 0.014* -0.091 0.213
TSMI -0.196 0.007* -0.117 0.108 -0.191 0.008* -0.089 0.222
ASMI -0.172 0.018* -0.123 0.091 -0.141 0.053 -0.080 0.277
Albumin -0.132 0.071 -0.084 0.252 -0.175 0.017* -0.184 0.012*
ALT -0.035 0.630 -0.072 0.327 -0.140 0.055 -0.081 0.269
Total bilirubin -0.096 0.293 -0.053 0.561 -0.031 0.734 -0.130 0.152
BUN -0.125 0.090 -0.034 0.648 -0.065 0.379 -0.107 0.147
Creatinine -0.087 0.235 -0.048 0.514 -0.076 0.298 0.275 <0.001*
Cr/Cys C -0.202 0.140 -0.036 0.795 -0.178 0.193 -0.068 0.621
Female
Age -0.131 0.302 0.070 0.583 NA NA 0.189 0.134
CCI -0.110 0.385 0.140 0.271 NA NA 0.115 0.366
Total SMI -0.175 0.166 0.038 0.767 NA NA -0.150 0.237
TSMI -0.183 0.149 0.038 0.768 NA NA -0.102 0.421
ASMI -0.154 0.225 0.035 0.783 NA NA -0.192 0.129
Albumin -0.120 0.348 -0.157 0.220 NA NA -0.104 0.416
ALT -0.034 0.792 -0.009 0.946 NA NA -0.127 0.323
Total bilirubin -0.032 0.851 0.999 0.999 NA NA -0.153 0.360
BUN -0.136 0.288 -0.173 0.176 NA NA -0.068 0.594
Creatinine -0.105 0.413 -0.094 0.463 NA NA 0.625 <0.001*
Cr/Cys C -0.345 0.099 0.401 0.052 NA NA -0.099 0.644

* p<0.05.

ER: emergency room; CCI: Charlson comorbidity index; SMI: skeletal muscle mass index; TSMI: trunk muscle mass index; ASMI: appendicular muscle mass index; ALT: alanine transaminase; BUN: blood urea nitrogen; Cr: creatinine; Cys C: cystatin C; NA: not applicable.

Table 4.
Cox regression model for acute exacerbation of COPD within 1 year
Variable Univariate
Multivariate
VIF
HR (95% CI) p-value HR (95% CI) p-value
Age, yr 0.983 (0.939-1.029) 0.459 1.071 (0.960-1.195) 0.219 1.156
Sex (vs. female) 1.856 (0.411-8.373) 0.421 41.283 (1.203-1,416.885) 0.039* 1.479
CCI (score) 1.088 (0.928-1.274) 0.298 0.890 (0.607-1.303) 0.548 1.348
History of osteoporosis 0.861 (0.191-3.887) 0.846 0.945 (0.124-7.206) 0.956 1.103
Previous AE COPD 1.408 (0.434-4.574) 0.569 3.304 (0.427-25.548) 0.252 1.277
Total SMI 0.807 (0.637-1.023) 0.077
TSMI 0.615 (0.385-0.982) 0.042* 0.200 (0.048-0.838) 0.028* 2.187
ASMI 0.733 (0.471-1.141) 0.169
BMI 0.881 (0.760-1.022) 0.095 0.946 (0.747-1.197) 0.644 1.646
Protein 0.709 (0.452-1.110) 0.133
Albumin 0.724 (0.472-1.111) 0.139
Aspartate aminotransferase 0.963 (0.848-1.093) 0.555
Alanine aminotransferase 0.977 (0.898-1.063) 0.587
Total bilirubin 0.125 (0.004-4.123) 0.243
Blood urea nitrogen 0.998 (0.901-1.106) 0.968
C-reactive protein 0.965 (0.836-1.113) 0.624
Creatinine 0.988 (0.354-2.762) 0.982
Cystatin C 3.375 (1.372-8.299) 0.008* 4.990 (1.070-23.278) 0.031* 1.188
Creatinine/cystatin C 0.071 (0.002-3.165) 0.172

* p<0.05.

In the multivariate analysis, we included variables known to influence exacerbation and muscle mass measurements, such as age, sex, Charlson comorbidity index, osteoporosis, previous AE COPD, and BMI, along with variables with a univariate p-value of <0.05.

COPD: chronic obstructive pulmonary disease; HR: hazard ratio; CI: confidence interval; VIF: variance inflation factor; CCI: Charlson comorbidity index; AE: acute exacerbation; SMI: skeletal muscle mass index; TSMI: trunk muscle mass index; ASMI: appendicular muscle mass index; BMI: body mass index.

REFERENCES

1. Chen LK, Woo J, Assantachai P, Auyeung TW, Chou MY, Iijima K, et al. Asian Working Group for Sarcopenia: 2019 consensus update on sarcopenia diagnosis and treatment. J Am Med Dir Assoc 2020;21:300-7.
crossref pmid
2. Benz E, Trajanoska K, Lahousse L, Schoufour JD, Terzikhan N, De Roos E, et al. Sarcopenia in COPD: a systematic review and meta-analysis. Eur Respir Rev 2019;28:190049.
crossref pmid pmc
3. Perrot L, Greil A, Boirie Y, Farigon N, Mulliez A, Costes F, et al. Prevalence of sarcopenia and malnutrition during acute exacerbation of COPD and after 6 months recovery. Eur J Clin Nutr 2020;74:1556-64.
crossref pmid pdf
4. Costa TM, Costa FM, Moreira CA, Rabelo LM, Boguszewski CL, Borba VZ. Sarcopenia in COPD: relationship with COPD severity and prognosis. J Bras Pneumol 2015;41:415-21.
crossref pmid pmc
5. Maltais F, Decramer M, Casaburi R, Barreiro E, Burelle Y, Debigare R, et al. An official American Thoracic Society/European Respiratory Society statement: update on limb muscle dysfunction in chronic obstructive pulmonary disease. Am J Respir Crit Care Med 2014;189:e15-62.
crossref pmid pmc
6. Spruit MA, Gosselink R, Troosters T, Kasran A, GayanRamirez G, Bogaerts P, et al. Muscle force during an acute exacerbation in hospitalised patients with COPD and its relationship with CXCL8 and IGF-I. Thorax 2003;58:752-6.
crossref pmid pmc
7. Gosker HR, Langen RC, Simons SO. Role of acute exacerbations in skeletal muscle impairment in COPD. Expert Rev Respir Med 2021;15:103-15.
crossref pmid
8. Byun MK, Cho EN, Chang J, Ahn CM, Kim HJ. Sarcopenia correlates with systemic inflammation in COPD. Int J Chron Obstruct Pulmon Dis 2017;12:669-75.
crossref pmid pmc pdf
9. Quan H, Sundararajan V, Halfon P, Fong A, Burnand B, Luthi JC, et al. Coding algorithms for defining comorbidities in ICD-9-CM and ICD-10 administrative data. Med Care 2005;43:1130-9.
crossref pmid
10. Cruz-Jentoft AJ, Bahat G, Bauer J, Boirie Y, Bruyere O, Cederholm T, et al. Sarcopenia: revised European consensus on definition and diagnosis. Age Ageing 2019;48:16-31.
crossref pmid pmc pdf
11. Wallengren O, Bosaeus I, Frandin K, Lissner L, Falk Erhag H, Wetterberg H, et al. Comparison of the 2010 and 2019 diagnostic criteria for sarcopenia by the European Working Group on Sarcopenia in Older People (EWGSOP) in two cohorts of Swedish older adults. BMC Geriatr 2021;21:600.
crossref pmid pmc pdf
12. Limpawattana P, Inthasuwan P, Putraveephong S, Boonsawat W, Theerakulpisut D, Sawanyawisuth K. Sarcopenia in chronic obstructive pulmonary disease: a study of prevalence and associated factors in the Southeast Asian population. Chron Respir Dis 2018;15:250-7.
crossref pmid pmc pdf
13. Baumgartner RN, Koehler KM, Romero L, Garry PJ. Serum albumin is associated with skeletal muscle in elderly men and women. Am J Clin Nutr 1996;64:552-8.
crossref pmid
14. Zinellu E, Fois AG, Sotgiu E, Mellino S, Mangoni AA, Carru C, et al. Serum albumin concentrations in stable chronic obstructive pulmonary disease: a systematic review and meta-analysis. J Clin Med 2021;10:269.
crossref pmid pmc
15. Qin J, Qin Y, Wu Y, Wei A, Luo M, Liao L, et al. Application of albumin/globulin ratio in elderly patients with acute exacerbation of chronic obstructive pulmonary disease. J Thorac Dis 2018;10:4923-30.
crossref pmid pmc
16. Shi T, Feng L. Blood biomarkers associated with acute type II respiratory failure in COPD: a meta-analysis. Clin Respir J 2022;16:75-83.
crossref pmid pmc pdf
17. Vespasiani-Gentilucci U, De Vincentis A, Ferrucci L, Bandinelli S, Antonelli Incalzi R, Picardi A. Low alanine aminotransferase levels in the elderly population: frailty, disability, sarcopenia, and reduced survival. J Gerontol A Biol Sci Med Sci 2018;73:925-30.
crossref pmid pmc
18. Gallo P, De Vincentis A, Bandinelli S, Ferrucci L, Picardi A, Antonelli Incalzi R, et al. Combined evaluation of aminotransferases improves risk stratification for overall and cause-specific mortality in older patients. Aging Clin Exp Res 2021;33:3321-31.
crossref pmid pdf
19. He Y, Ding F, Yin M, Zhang H, Hou L, Cui T, et al. High serum AST/ALT ratio and low serum INS*PA product are risk factors and can diagnose sarcopenia in middle-aged and older adults. Front Endocrinol (Lausanne) 2022;13:843610.
crossref pmid pmc
20. Choi YJ, Kwon DS, Kim T, Cho JH, Kim HJ, Byun MK, et al. Low alanine aminotransferase as a risk factor for chronic obstructive pulmonary disease in males. Sci Rep 2021;11:14829.
crossref pmid pmc pdf
21. Lasman N, Shalom M, Turpashvili N, Goldhaber G, Lifshitz Y, Leibowitz E, et al. Baseline low ALT activity is associated with increased long-term mortality after COPD exacerbations. BMC Pulm Med 2020;20:133.
crossref pmid pmc pdf
22. Dharnidharka VR, Kwon C, Stevens G. Serum cystatin C is superior to serum creatinine as a marker of kidney function: a meta-analysis. Am J Kidney Dis 2002;40:221-6.
crossref pmid
23. Inker LA, Titan S. Measurement and estimation of GFR for use in clinical practice: core curriculum 2021. Am J Kidney Dis 2021;78:736-49.
crossref pmid
24. Lin YL, Chen SY, Lai YH, Wang CH, Kuo CH, Liou HH, et al. Serum creatinine to cystatin C ratio predicts skeletal muscle mass and strength in patients with non-dialysis chronic kidney disease. Clin Nutr 2020;39:2435-41.
crossref pmid
25. Zheng C, Wang E, Li JS, Xie K, Luo C, Ge QY, et al. Serum creatinine/cystatin C ratio as a screening tool for sarcopenia and prognostic indicator for patients with esophageal cancer. BMC Geriatr 2022;22:207.
crossref pmid pmc pdf
26. Hashimoto Y, Takahashi F, Okamura T, Osaka T, Okada H, Senmaru T, et al. Relationship between serum creatinine to cystatin C ratio and subclinical atherosclerosis in patients with type 2 diabetes. BMJ Open Diabetes Res Care 2022;10:e002910.
crossref pmid pmc
27. Hirai K, Tanaka A, Homma T, Goto Y, Akimoto K, Uno T, et al. Serum creatinine/cystatin C ratio as a surrogate marker for sarcopenia in patients with chronic obstructive pulmonary disease. Clin Nutr 2021;40:1274-80.
crossref pmid
28. Chai L, Feng W, Zhai C, Shi W, Wang J, Yan X, et al. The association between cystatin C and COPD: a meta-analysis and systematic review. BMC Pulm Med 2020;20:182.
crossref pmid pmc pdf


ABOUT
ARTICLE & TOPICS
Article category

Browse all articles >

Topics

Browse all articles >

BROWSE ARTICLES
FOR CONTRIBUTORS
Editorial Office
101-605, 58, Banpo-daero, Seocho-gu (Seocho-dong, Seocho Art-Xi), Seoul 06652, Korea
Tel: +82-2-575-3825, +82-2-576-5347    Fax: +82-2-572-6683    E-mail: katrdsubmit@lungkorea.org                

Copyright © 2024 by The Korean Academy of Tuberculosis and Respiratory Diseases. All rights reserved.

Developed in M2PI

Close layer
prev next