Tuberc Respir Dis > Volume 87(2); 2024 > Article
Kim, Heo, Kim, Park, Yoon, Jung, Ra, Jung, Yoo, and Kim: Factors Associated with the Discrepancy between Exercise Capacity and Airflow Limitation in Patients with Chronic Obstructive Pulmonary Disease

Abstract

Background

Exercise capacity is associated with lung function decline in chronicobstructive pulmonary disease (COPD) patients, but a discrepancy between exercisecapacity and airflow limitation exists. This study aimed to explore factors contributingto this discrepancy in COPD patients.

Methods

Data for this prospective study were obtained from the Korean COPD SubgroupStudy. The exercise capacity and airflow limitation were assessed using the6-minute walk distance (6-MWD; m) and forced expiratory volume in 1 second (FEV1).Participants were divided into four groups: FEV1 >50%+6-MWD >350, FEV1 >50%+6-MWD ≤350, FEV1 ≤50%+6-MWD >350, and FEV1 ≤50%+6-MWD ≤350 and their clinicalcharacteristics were compared.

Results

A total of 883 patients (male:female, 822:61; mean age, 68.3±7.97 years) wereenrolled. Among 591 patients with FEV1 >50%, 242 were in the 6-MWD ≤350 group, andamong 292 patients with FEV1 ≤50%, 185 were in the 6-MWD >350 group. The multipleregression analyses revealed that male sex (odds ratio [OR], 8.779; 95% confidence interval[CI], 1.539 to 50.087; p=0.014), current smoking status (OR, 0.355; 95% CI, 0.178to 0.709; p=0.003), and hemoglobin levels (OR, 1.332; 95% CI, 1.077 to 1.648; p=0.008)were significantly associated with discrepancies in exercise capacity and airflow limitationin patients with FEV1 >50%. Meanwhile, in patients with FEV1 ≤50%, diffusioncapacity of carbon monoxide (OR, 0.945; 95% CI, 0.912 to 0.979; p=0.002) was significantlyassociated with discrepancies between exercise capacity and airflow limitation.

Conclusion

The exercise capacity of COPD patients may be influenced by factors otherthan airflow limitation, so these aspects should be considered when assessing andtreating patients.

Introduction

Reduced exercise capacity is a key clinical feature in chronic obstructive pulmonary disease (COPD) patients [1] who are usually associated with a decline in lung function, particularly forced expiratory volume in 1 second (FEV1) [2].
Studies on the association between the degree of airflow limitation and exercise capacity in COPD revealed that patients with minor airflow limitation do not have a decreased exercise capacity. However, patients with moderate airflow limitation are reported to exhibit a reduced exercise capacity [3]. In a study comprising 118 COPD patients, the 6-minute walk distance (6-MWD) test results, used to assess exercise capacity, indicated that the performance of patients with severe airflow limitation was approximately 30% worse than those with mild airflow limitation [4].
However, the severity of the airflow limitation in COPD patients cannot be used to accurately predict a decline in exercise capacity. Spruit et al. [5]’s study including 1,795 individuals with COPD investigated the predictors of poor 6-MWD test results (≤350 m). They reported that, in addition to significant airflow limitation, a high degree of emphysema, more depressed mood, and greater perception of dyspnea symptoms were related to a decreased exercise capacity [5]. Furthermore, regardless of the airflow limitation level, patients more vulnerable to dynamic hyperinflation display a more reduced exercise capacity [6,7].
These studies suggest that decreased exercise capacity in COPD is highly complex, involving a wide range of contributing factors. In clinical practice, we often encounter patients with preserved exercise capacity despite significant airflow limitations, while others exhibit profoundly reduced exercise capacity despite mild airflow restrictions. Thus, this study aimed to identify the variables that contribute to the discrepancy between exercise capacity and airflow limitation in COPD patients.

Materials and Methods

1. Study population

This study included patients from the Korean COPD Subgroup Study cohort, since December 2011, a multicenter, prospective observational cohort of COPD patients from 53 centers in South Korea. The inclusion criteria were over 40 years old and a postbronchodilator FEV1/forced vital capacity (FVC) ratio of 0.7. To enroll the patients, physicians or skilled nurses used case-report forms to record information such as age, sex, height, weight, smoking status, patient-reported education level, area of residence, comorbidities, and respiratory symptoms such as cough and sputum production. In addition, results for 6-MWD, the COPD assessment test (CAT), COPD-specific St. George’s Respiratory Questionnaire (SGRQ), Beck Depression Inventory (BDI) score, and modified Medical Research Council (mMRC) score for dyspnea severity were evaluated [8]. A serologic laboratory test was also performed. During the first year of follow-up after enrollment, the occurrence and frequency of exacerbations were examined.

2. Pulmonary function test, 6-MWD test, and COPD severity

During enrolment, spirometer, diffusion capacity of carbon monoxide (DLCO), lung volume measurement, and 6-MWD were measured according to the recommendations of the American Thoracic Society and European Respiratory Society [9]. The severity of COPD was classified according to the Global Initiative for Chronic Obstructive Lung Disease (GOLD) guideline. Lung function severity was classified as GOLD stage 1 (FEV1 ≥80%), GOLD stage 2 (50%≤ FEV1 <80%), GOLD stage 3 (30%≤ FEV1 <50%), and GOLD stage 4 (FEV1 <30%).

3. Group assignment

The patients were divided into four groups according to their FEV1 and 6-MWD results. To differentiate between mild to moderate and severe to very severe airflow limitation, the threshold for FEV1 was 50%, which separates GOLD stages 1-2 from GOLD stages 3-4. To distinguish between high and low exercise capacity among the participants, the threshold for the 6-MWD was set as 350 m, which was considered “poor 6-MWD” in the Evaluation of COPD Longitudinally to Identify Predictive Surrogate End-points (ECLIPSE) study [10]. Therefore, the four groups were as follows: group 1 (high FEV1 >50% and high 6-MWD >350 m), group 2 (high FEV1 >50% and low 6-MWD ≤350 m), group 3 (low FEV1 ≤50% and high 6-MWD >350 m), and group 4 (low FEV1 ≤50% and low 6-MWD ≤350 m).

4. Ethics statement

This study adhered to the Declaration of Helsinki guidelines, and written informed consent was obtained from all the participants. The study was approved by the Institutional Review Board of Gyeongsang National University Changwon Hospital (GNUCH-2023-03-029).

5. Statistical analyses

Categorical variables are reported as frequencies and percentages, whereas all continuous variables are described as mean and standard deviation. To examine continuous variables for normal and nonnormal data distributions, respectively, a two-sample t-test or the Mann-Whitney U test was applied and the Fisher’s exact test or the chi-squared test was used to assess categorical values. Multiple logistic regression analyses were conducted to assess the components that may contribute to the discrepancy between exercise capacity and airflow limitation. Covariates were selected for the logistic regression model based on univariate analysis (p>0.2) and clinical relevance. Age, sex, body mass index (BMI), smoking status, the Charlson comorbidity index (CCI), lung volume, the DLCO, and FEV1 values from pulmonary function tests, the CAT and BDI scores, and the mMRC score were covariates along with exacerbation from the prior year and laboratory test. A p-value of 0.05 was regarded as statistically significant for all comparisons. The SPSS version 25.0 for Windows (IBM Company, Armonk, NY, USA) was used for all statistical analyses.

Results

1. Baseline characteristics

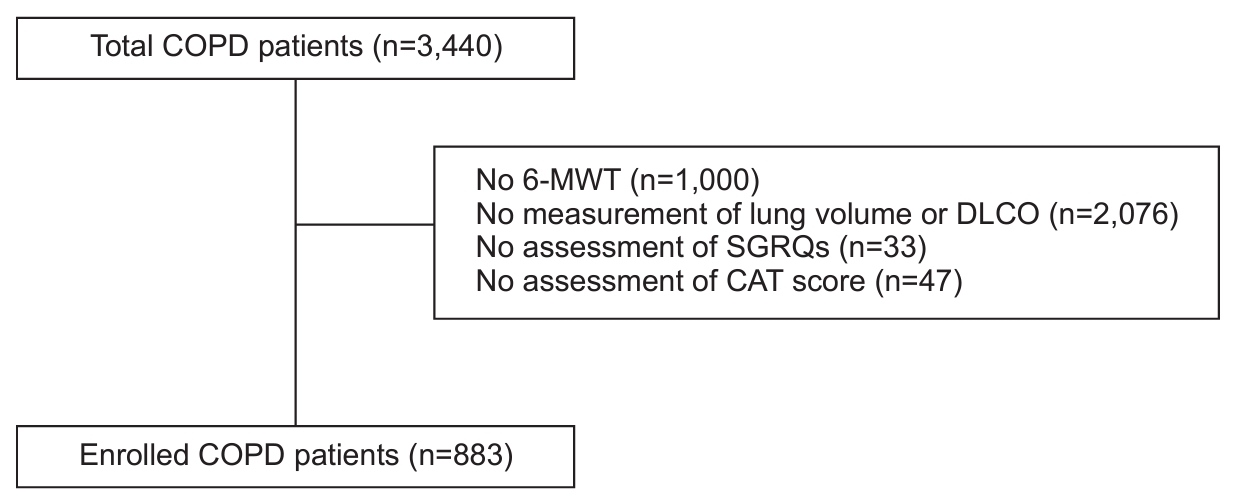
A total of 883 patients were included in the study. We only included patients who had completed the 6-MWD test and pulmonary function tests, including diffusion capacity and lung volume measurements. These patients completed the CAT and SGRQ (Figure 1). The median age of the 883 patients was 70 years (interquartile range, 64 to 74), with males accounting for 92.9% of the study population. The mean BMI of the patients was 23.4±3.33 kg/m2, and current smokers accounted for 64.3% of the study population. The CCI was 0.3±0.69. The FEV1 was 1.76±0.64 and %FEV1 was 60.3±19.76. The DLCO (%) was 66.4±20.86 and residual volume (RV)/total lung capacity (TLC) (%) was 40.6±12.04. The 6-MWD was 384.7±112.83 m. CAT and SGRQ total scores were 12.9±7.46 and 25.5±18.36, respectively. Table 1 shows the baseline characteristics of the study population.

2. Comparison of the clinical characteristics of four groups of COPD patients

The characteristics of the groups, including pulmonary function and 6-MWD, are shown in Table 2. There were 591 patients with FEV1 >50% and 292 patients with FEV1 ≤50%. Among the 591 patients with FEV1 >50%, 349 (59%) and 242 (41%) patients had 6-MWD >350 m and ≤350 m, respectively (Figure 2). Age and the CCI were substantially higher in the 6-MWD ≤350 m group than in the 6-MWD >350 m group (70.1±9.1 vs. 67.2±7.4, p=0.001; 0.34±0.76 vs. 0.29±0.63, p=0.001; respectively). However, the proportion of current smokers was significantly higher in the 6-MWD >350 m group than in the 6-MWD ≤350 m group (34.4 vs. 15.3, p=0.001). For the pulmonary function test, the FEV1 (L), FVC (%), and FEV1/FVC (%) were significantly higher in the 6-MWD ≤350 m group than in the 6-MWD >350 m group (2.0±0.47 vs. 2.17±0.63, p=0.001; 67.6±12.6 vs. 75.3±16.5, p=0.001; 56.68±8.99 vs. 59.88±13.02, p=0.001; respectively). RV/TLC (%) was significantly higher in the 6-MWD >350 m group than in the 6-MWD ≤350 m group (37.4±9.15 vs. 34.6±10.24, p=0.001). The 6-MWD was significantly higher in the 6-MWD >350 m group than in the 6-MWD ≤350 m group (463.56±72.03 vs. 278.37±52.15, p=0.001). In addition, the hemoglobin levels and lymphocyte count (%) were significantly lower in the 6-MWD ≤350 m group than in the 6-MWD >350 m group (14.25±1.48 vs. 14.54±1.40, p=0.01; 29.68±8.72 vs. 31.36±9.19, p=0.015; respectively).
In 292 patients with FEV1 ≤50%, 185 (63.3%) and 107 (36.7%) patients were in the 6-MWD >350 m and ≤350 m groups, respectively. Age and the CCI were significantly higher in the 6-MWD ≤350 m group than in the 6-MWD >350 m group (69.29±7.55 vs. 67.28±7.1, p=0.012; 0.41±0.71 vs. 0.36±0.71, p=0.001; respectively). However, the proportion of current smokers was significantly higher in the 6-MWD >350 m group than in the 6-MWD ≤350 m group (29.2 vs. 16.8, p=0.019). The pulmonary function test revealed that the FEV1 (L), FEV1/FVC (%), and DLCO (%) were significantly lower in the 6-MWD ≤350 m group than in the 6-MWD >350 m group (1.09±0.88 vs. 1.18±0.26, p=0.007; 38.06±9.10 vs. 40.99±9.03, p=0.004; 49.6±18.6 vs. 59.7±17.5, p=0.001; respectively). RV/TLC (%) was significantly higher in the 6-MWD ≤350 m group than in the 6-MWD >350 m group (51.43±13.15 vs. 48.2±10.39, p=0.001). For the laboratory findings, the troponin I level was significantly higher in the 6-MWD ≤350 m group than in the 6-MWD >350 m group (0.07±0.41 vs. 0.05±0.05, p=0.012). CAT score, SGRQ total score, and BDI were significantly higher in the 6-MWD ≤350 m group than in the 6-MWD >350 m group (17.7±8.54 vs. 14.79±7.45, p=0.001; 40.58±25.2 vs. 30.95±16.68, p=0.001; 8.84±10.03 vs. 6.06±7.32, p=0.009; respectively).

3. Factors associated with the discrepancy between airflow limitation and exercise capacity in mild to moderate COPD patients

Multiple logistic regression analyses revealed that males (odds ratio [OR], 8.779; 95% confidence interval [CI], 1.539 to 50.087; p=0.014), current smoking status (OR, 0.355; 95% CI, 0.178 to 0.709; p=0.003), and hemoglobin levels (OR, 1.332; 95% CI, 1.077 to 1.648; p=0.008) were substantially related to differences in exercise capacity and airflow limitation in patients with mild to severe COPD (Table 3). This discrepancy was not linked to pulmonary function test results or laboratory findings.

4. Factors associated with the discrepancy between airflow limitation and exercise capacity in severe to very severe COPD patients

Multiple logistic regression analyses showed that DLCO (OR, 0.945; 95% CI, 0.912 to 0.979; p=0.002) was substantially associated with the discrepancy between airflow limitation and exercise capacity in patients with severe to very severe COPD (Table 4). There was no correlation between the severity of airway obstruction, smoking status, and laboratory results.

Discussion

This study investigated the characteristics and factors that are related to reduced exercise capacity despite mild to moderate airflow limitation and a higher exercise capacity despite severe to very severe airflow limitation in patients who had COPD. The main findings of this study were as follows. First, many COPD patients showed a discrepancy between the degree of airflow limitation and exercise capacity. In this study, 40% of the COPD patients with mild to moderate airflow limitation (FEV1 >50%) exhibited a lower 6-MWD (≤350). Conversely, 36% of COPD patients with severe to very severe airflow limitation (FEV1 ≤50%) exhibited a higher 6-MWD (>350). Second, in patients with mild to moderate airflow limitation, male sex, smoking status, and hemoglobin level were associated with a discrepancy between airflow limitation and exercise capacity. In COPD patients with severe to very severe airflow limitation, the diffusion capacity of the lung was found to have an association with this discrepancy.
In this study, smoking status was associated with discrepancies between the degree of airflow limitation and exercise capacity in COPD patients with mild and moderate airflow limitation. It was found that patients with mild to moderate COPD who were current smokers had a considerably better capacity for exercise than anticipated. A previous study in China that compared the clinical characteristics of 4,331 COPD patients between current and former smokers indicated that current smokers have higher exercise capacity than former smokers [11]. This data reflects that in situations when the degree of airway obstruction is less severe, those with substantially higher exercise capacity are more likely to continue smoking. However, several studies have demonstrated that smoking status may have a negative influence on exercise capacity in healthy older individuals and patients with COPD. In another study of 154 older healthy individuals, 6-MWD according to their smoking status was measured [12]. Although the level of physical activity did not differ according to smoking status, current and ex-smokers had about 20% shorter 6-MWD than nonsmokers. In addition, current smokers without COPD showed a shorter 6-MWD than nonsmokers. Although handgrip and limb muscle strength were not different, the average 6-MWD in nonsmokers was significantly higher than that in smokers [13]. In addition, COPD patients who stopped smoking showed shorter 6-MWD than those who did not stop (305.23±58.36 m vs. 368.87±53.49 m, respectively), but had similar airflow obstruction (1.44±0.56 m vs. 1.57±0.77 m, respectively) [14].
In our study, male COPD patients showed higher exercise capacity at higher degrees of airflow limitation. Data from the female COPD patients cohort study indicated that despite similar predicted FEV1 values, females exhibited significantly shorter 6-MWD than males (366±89.9 vs. 384±120.5) [15]. Therefore, sex may affect exercise capacity in COPD patients showing higher exercise capacity in male despite some degree of airflow limitation.
There is a significant relationship between hemoglobin levels and exercise capacity in COPD patients. Low hemoglobin levels can contribute to reduced exercise capacity and poor 6-MWD in COPD patients. A previous study indicated that among 105 patients with COPD (FEV1=1.3±0.6), patients with anemia (12.3%) covered a significantly shorter 6-MWD (267.9±86.7) compared to patients without anemia (373.0±122.8, p=0.001) suggesting that hemoglobin levels were independently associated with decreased exercise capacity [16]. In a cohort of 683 stable COPD patients, patients with anemia experienced significantly higher levels of dyspnea, reduced exercise capacity, and shorter median survival duration compared to their nonanemic counterparts [17]. In our study, in COPD patients with mild to moderate airflow obstruction, hemoglobin levels were found to be associated with a discrepancy between airflow limitation and 6-MWD. This may reflect that maintaining hemoglobin levels may improve exercise capacity in COPD patients. Further, a previous study indicated that the intravenous administration of iron improved exercise capacity and reduced breathlessness in COPD patients [18].
In our study, an association between DLCO and differences between the degree of airflow limitation and exercise capacity were observed in COPD patients with severe to very severe airflow limitation. Several studies have reported that DLCO is a strong predictor of exercise capacity in COPD patients. In a previous study that examined 6-MWD, spirometer, lung volume, and DLCO in 130 stable COPD patients, only DLCO was observed to be substantially linked with 6-MWD in multivariate analysis [19]. In addition, a decline of 6-MWD (>30 m) was reported to be associated with reduced DLCO regardless of similar FEV1 value [20]. Similar to our findings, these studies suggest that even severe to very severe airflow obstruction COPD patients with preserved diffusion capacity may demonstrate preserved exercise capacity.
There were some limitations to our investigation. First, some COPD patients did not complete the 6-MWD test due to dyspnea or muscle fatigue in their limbs. These patients were typically older, had a lower BMI, and experienced skeletal muscle atrophy, which could be attributed to medication use or the effects of COPD itself. Additionally, there may have been variations in the timing of the 6-MWD test among the study participants. The test is usually performed as an initial assessment for COPD, to avoid the influence of medication. However, it can also be conducted while patients are taking medications, such as bronchodilators. Consequently, the exercise performance of these patients may have been compromised.
In conclusion, this study demonstrated that the discrepancy between airflow limitation and exercise capacity in COPD patients was associated with sex, smoking status, hemoglobin levels, and lung diffusion capacity. Therefore, it suggests that exercise capacity in COPD patients may be influenced by various factors beyond airflow limitation, highlighting the importance of considering these aspects when assessing and treating patients.

Notes

Authors’ Contributions

Conceptualization: Kim TH, Kim HC. Methodology: Kim HC. Formal analysis: Kim HC. Data curation: Heo IR, Kim NY, Park JH, Yoon HY, Jung JY, Ra SW, Jung KS, Yoo KH. Software: Kim HC. Validation: Kim HC. Writing - original draft preparation: Kim TH, Kim HC. Writing - review and editing: Heo IR, Kim NY, Park JH, Yoon HY, Jung JY, Ra SW, Jung KS, Yoo KH. Approval of final manuscript: all authors.

Conflicts of Interest

No potential conflict of interest relevant to this article was reported.

Funding

This work was supported by a Research Program funded by the Korea National Institute of Health (Fund CODE 2016ER670100, 2016ER670101, 2016ER670102, 2018 ER67100, 2018ER67101, 2018ER67102, 2021ER120500, 2021ER120501, and 2021ER120502).

Fig. 1.
Flow diagram of the study population. COPD: chronic obstructive pulmonary disease; 6-MWD: 6-minute walk distance; DLCO: diffusion capacity carbon monoxide; SGRQ: St. George’s Respiratory Questionnaire; CAT: COPD assessment test.
trd-2023-0068f1.jpg
Fig. 2.
Classification of the patients into four groups according to forced expiratory volume in 1 second (FEV1) and 6-minute walk distance (6-MWD). COPD: chronic obstructive pulmonary disease.
trd-2023-0068f2.jpg
Table 1.
Clinical characteristics of the enrolled COPD patients
Characteristic COPD (n=883)
Age, yr 68.3±7.97
Male sex 820 (92.9)
BMI, kg/m2 23.4±3.33
Education level (>12 years) 162 (18.3)
Residence, urban area 742 (83.8)
Smoking status
 Current smoker 229 (25.9)
 Never smoker 85 (9.6)
 Ex-smoker 569 (64.4)
CCI score 0.3±0.69
Cough over 3 months/year 207 (23.4)
Sputum over 3 months/year 300 (33.9)
Pulmonary function test
 FEV1, L 1.76±0.64
 FEV1, % 60.3±19.76
 FVC, L 3.38±0.80
 FVC, % 81.9±16.03
 FEV1/FVC, mL/min/mm Hg 52.0±13.40
 DLCO, mL/min/mm Hg 13.71±4.86
 DLCO, % 66.4±20.86
 RV/TLC, % 40.6±12.04
mMRC 1.23±0.92
mMRC >2 260 (30.6)
CAT score 12.9±7.46
SGRQ total score 25.5±18.36
BDI (n=744) 6.08±7.68
Exacerbation at recent 1-year, % (n=441) 85 (9.6)
6-MWD 384.7±112.83
Laboratory finding
 WBC, 109/L (n=831) 7.07±2.20
 Hemoglobin, g/dL (n=831) 14.4±1.43
 Hematocrit, % (n=829) 43.2±4.31
 Neutrophil, % (n=820) 58.47±10.53
 Lymphocyte, % (n=820) 28.6±9.17
 Eosinophil, % (n=820) 3.19±3.05
 BUN, mg/dL (n=789) 16.55±5.76
 Creatinine, mg/dL (n=797) 1.03±0.89
 Albumin, g/dL (n=788) 4.47±0.35
 IgE, IU/mL (n=419) 263.5±442.26
 CRP, mg/L (n=439) 2.35±4.21
 IL-6, pg/mL (n=152) 173.9±710.06
 Troponin I, ng/mL (n=313) 15.9±4.47
 Pro-BNP, pg/mL (n=366) 161.2±408.9
 D-dimer, µg/mL (n=324) 0.5±0.64

Values are presented as mean±standard deviation or number (%).

COPD: chronic obstructive pulmonary disease; BMI: body mass index; CCI: Charlson comorbidity index; FEV1: forced expiratory volume in 1 second; FVC: forced vital capacity; DLCO: diffusion capacity carbon monoxide; RV: residual volume; TLC: total lung capacity; mMRC: modified Medical Research Council; CAT: COPD assessment test; SGRQ: St. George's Respiratory Questionnaire; BDI: Beck depression inventory; 6-MWD: 6-minute walk distance; WBC: white blood cell; BUN: blood urea nitrogen; IgE: immunoglobulin E; CRP: C-reactive protein; IL: interleukin; BNP: brain natriuretic peptide.

Table 2.
Comparison of the clinical characteristics of the four groups according to FEV1 and the 6-MWD
Characteristic FEV1 >50% (n=591)
FEV1 ≤50% (n=292)
6-MWD >350 m (n=349) 6-MWD ≤350 m (n=242) p-value 6-MWD >350 m (n=185) 6-MWD ≤350 m (n=107) p-value
Age, yr 67.2±7.4 70.1±9.1 0.001 67.28±7.10 69.29±7.55 0.012
Male sex, % 318 (91.1) 230 (95) 0.071 173 (93.5) 99 (92.5) 0.747
BMI, kg/m2 23.9±2.98 23.9±3.17 0.419 22.4±3.15 22.4±4.31 0.483
Education level (>12 years) 69 (19.5) 49 (20.2) 0.832 32 (17.3) 11 (10.3) 0.103
Residence, urban area, % 202 (58) 181 (75.1) 0.045 105 (57.1) 65 (60.7) 0.287
Smoking status
 Current smoker 120 (34.4) 37 (15.3) 0.001 54 (29.2) 18 (16.8) 0.019
 Never smoker 35 (10) 24 (9.9) 19 (10.3) 7 (6.5)
 Ex-smoker 197 (55.6) 181 (74.8) 112 (60.5) 82 (76.6)
 CCI score 0.29±0.63 0.34±0.76 0.001 0.36±0.71 0.41± 0.71 0.001
Cough over 3 months/year 74 (21.4) 51 (21.1) 0.913 52 (28.3) 30 (28.0) 0.967
Sputum over 3 months/year 112 (32.5) 84 (34.7) 0.570 66 (35.9) 38 (35.5) 0.951
Pulmonary function test
 FEV1, L 2.0±0.47 2.17±0.63 0.001 1.18±0.26 1.09±0.88 0.007
 FEV1, % 67.6±12.6 75.3±16.5 0.001 39.68±7.63 38.1±8.72 0.001
 FVC, L 3.55±0.71 3.64±0.81 0.086 2.96±0.74 2.94±0.71 0.386
 FVC, % 86.1±13.7 88.0±14.8 0.086 71.7±14.8 72.4±14.8 0.386
 FEV1/FVC, mL/min/mm Hg 56.68±8.99 59.88±13.02 0.001 40.99±9.03 38.06±9.10 0.004
 DLCO, mL/min/mm Hg 14.9±4.74 14.5±4.88 0.152 12.46±4.16 10.14±4.13 0.001
 DLCO, % 72.0±20.0 70.7±20.1 0.231 59.7±17.5 49.6±18.6 0.001
 RV/TLC, % 37.4±9.15 34.6±10.24 0.001 48.2±10.39 51.43±13.15 0.011
mMRC >2 42 (55.3) 34 (44.7) 0.048 50 (55.6) 40 (44.4) 0.001
CAT score 11.6±6.48 11.4±7.13 0.422 14.79±7.45 17.7±8.54 0.001
SGRQ total score 20.45±14.95 20.89±15.81 0.332 30.95±16.68 40.58±25.2 0.001
BDI, L 5.32±6.98 6.13±7.65 0.053 6.06±7.32 8.84±10.03 0.009
Exacerbation at recent 1 years 30 (8.6) 11 (4.5) 0.001 37 (20.0) 28 (26.2) 0.040
6-MWD, m 463.56±72.03 278.37±52.15 0.001 447.02±64.93 258.86±79.95 0.001
Laboratory finding
 WBC, 103/µL 6.92±2.14 6.78±2.13 0.760 7.40±2.26 7.68±2.34 0.168
 Hemoglobin, g/dL 14.54±1.40 14.25±1.48 0.01 14.58±1.34 14.32±1.54 0.078
 Hematocrit, % 43.29±4.55 42.77±4.14 0.085 43.77±3.96 43.15±4.45 0.120
 Neutrophil, % 56.96±10.55 57.63±10.08 0.224 61.35±9.90 60.33±11.39 0.223
 Lymphocyte, % 31.36±9.19 29.68±8.72 0.015 27.14±8.6 27.92±9.89 0.251
 Eosinophil, % 3.13±2.92 3.62±3.63 0.042 2.81±2.34 3.00±2.93 0.273
 BUN, mg/dL 16.5±5.92 17.47±5.51 0.027 15.46±5.10 16.37±6.67 0.111
 Creatinine, mg/dL 1.00±0.95 1.05±0.27 0.211 1.05±1.34 1.02±0.69 0.427
 Albumin, g/dL 4.48±0.33 4.54±0.35 0.024 4.40±0.37 4.39±0.38 0.461
 CRP, mg/L 2.47±5.06 1.96±3.16 0.155 3.03±4.42 1.74±2.07 0.029
 IL-6, pg/mL 168.3±747.39 181.59±735.8 0.466 217.34±670.16 40.±735.8 0.247
 Troponin I, ng/mL 0.06±0.04 0.1±0.74 0.237 0.05±0.05 0.07±0.41 0.012
 Pro-BNP, pg/mL 125.1±311.4 170.7±394.0 0.143 239.6±666.1 149.1±191.6 0.224
 D-dimer, µg/mL 0.49±0.72 0.48±0.47 0.423 0.44±0.66 0.70±0.75 0.059

Values are presented as mean±standard deviation or number (%).

FEV1: forced expiratory volume in 1 second; 6-MWD: 6-minute walk distance; BMI: body mass index; CCI: Charlson comorbidity index; FVC: forced vital capacity; DLCO: diffusion capacity carbon monoxide; RV: residual volume; TLC: total lung capacity; mMRC: modified Medical Research Council; CAT: COPD assessment test; SGRQ: St. George’s Respiratory Questionnaire; BDI: Beck depression inventory; WBC: white blood cell; BUN: blood urea nitrogen; CRP: C-reactive protein; IL: interleukin; BNP: brain natriuretic peptide.

Table 3.
Factors associated with a lower 6-MWD (≤350 m) in COPD patients with mild to moderate airflow obstruction (FEV1 >50%)
Variable Univariate analysis
Multivariate analysis
Adjusted OR 95% CI p-value Adjusted OR 95% CI p-value
Age, yr 0.956 0.936-0.976 <0.001 0.977 0.350-0.998 0.295
Male sex 1.868 0.939-3.716 0.075 8.779 1.539-50.087 0.014
BMI, kg/m2 0.994 0.942-1.049 0.835
Residence, urban area 1.618 1.007-2.600 0.047 1.499 0.696-3.229 0.301
Smoking status, current 0.344 0.228-0.521 <0.001 0.355 0.178-0.709 0.003
CCI 0.889 0.702-1.126 0.330
FEV1, % 0.965 0.953-0.976 <0.001 0.984 0.959-1.009 0.206
DLCO, % 1.003 0.995-1.011 0.461
RV/TLC, % 1.031 1.013-1.050 0.001 0.990 0.953-1.028 0.601
mMRC >2 1.450 0.979-2.147 0.064 1.842 0.892-3.805 0.099
CAT score 1.002 0.978-1.027 0.842
BDI 0.985 0.962-1.009 0.221
SGRQ 1.002 0.992-1.013 0.660
Exacerbation in the past 1 year 0.483 0.190-1.225 0.125 0.517 0.171-1.565 0.243
Hemoglobin 1.151 1.002-1.296 0.020 1.332 1.077-1.648 0.008
Lymphocyte count 1.021 1.002-1.041 0.031 1.012 0.981-1.044 0.444
Albumin, serum 0.603 0.364-0.990 0.050 0.752 0.312-1.812 0.525

6-MWD: 6-minute walk distance; COPD: chronic obstructive pulmonary disease; FEV1: forced expiratory volume in 1 second; OR: odds ratio; CI: confidence interval; BMI: body mass index; CCI: Charlson comorbidity index; DLCO: diffusion capacity carbon monoxide; RV: residual volume; TLC: total lung capacity; mMRC: modified Medical Research Council, CAT: COPD assessment test; BDI: Beck depression inventory; SGRQ: St. George’s Respiratory Questionnaire.

Table 4.
Factors associated with higher 6-MWD (>350 m) in COPD patients with severe to very severe airflow obstruction (FEV1 ≤50%)
Variable Univariate analysis
Multivariate analysis
Adjusted OR 95% CI p-value Adjusted OR 95% CI p-value
Age, yr 1.039 1.005-1.074 0.024 1.002 0.933-1.075 0.967
Male sex 1.165 0.461-2.947 0.747
BMI, kg/m2 1.001 0.938-1.070 0.967
Residence, urban area 0.693 0.353-1.364 0.289
Smoking status, current 2.038 1.121-3.705 0.020 3.403 0.919-12.604 0.067
CCI 1.111 0.800-1.543 0.530
FEV1, % 0.976 0.948-1.005 0.108 1.026 0.960-1.095 0.451
DLCO, % 0.968 0.954-0.983 <0.001 0.945 0.912-0.979 0.002
RV/TLC, % 1.025 1.003-1.047 0.024 1.028 0.985-1.073 0.208
mMRC >2 0.509 0.314-0.825 0.006 0.668 0.216-2.063 0.483
CAT score 1.047 1.016-1.080 0.003 1.063 0.975-1.160 0.164
BDI 1.038 1.005-1.072 0.022 1.037 0.964-1.115 0.327
SGRQ 1.023 1.011-1.035 <0.001 0.969 0.935-1.005 0.087
Exacerbation in the past 1 year 0.418 0.211-0.826 0.012 0.539 0.203-1.432 0.215
Hemoglobin 0.882 0.741-1.050 0.158 0.949 0.682-1.320 0.756
Lymphocyte count 1.010 0.982-1.038 0.501
Albumin, serum 0.966 0.486-1.920 0.922

6-MWD: 6-minute walk distance; COPD: chronic obstructive pulmonary disease; FEV1: forced expiratory volume in 1 second; OR: odds ratio; CI: confidence interval; BMI: body mass index; CCI: Charlson comorbidity index; DLCO: diffusion capacity carbon monoxide; RV: residual volume; TLC: total lung capacity; mMRC: modified Medical Research Council; CAT: COPD assessment test; BDI: Beck depression inventory; SGRQ: St. George’s Respiratory Questionnaire.

References

1. Calverley PM. Exercise and dyspnoea in COPD. Eur Respir Rev 2006;15:72-9.
crossref
2. Tantucci C, Modina D. Lung function decline in COPD. Int J Chron Obstruct Pulmon Dis 2012;7:95-9.
crossref pmid pmc
3. Pinto-Plata VM, Celli-Cruz RA, Vassaux C, Torre-Bouscoulet L, Mendes A, Rassulo J, et al. Differences in cardiopulmonary exercise test results by American Thoracic Society/European Respiratory Society-Global Initiative for Chronic Obstructive Lung Disease stage categories and gender. Chest 2007;132:1204-11.
crossref pmid
4. Krishna BS, Mohapatra AK, Behera D, Jagaty SK, Subhankar S, Venkataram R, et al. Six-minute walk test and its correlation with spirometry in stable COPD patients. J Health Allied Sci NU 2021;12:280-5.
crossref
5. Spruit MA, Watkins ML, Edwards LD, Vestbo J, Calverley PM, Pinto-Plata V, et al. Determinants of poor 6-min walking distance in patients with COPD: the ECLIPSE cohort. Respir Med 2010;104:849-57.
crossref pmid
6. O’Donnell DE, Revill SM, Webb KA. Dynamic hyperinflation and exercise intolerance in chronic obstructive pulmonary disease. Am J Respir Crit Care Med 2001;164:770-7.
crossref pmid
7. O’Donnell DE, Webb KA. The major limitation to exercise performance in COPD is dynamic hyperinflation. J Appl Physiol (1985) 2008;105:753-7.
crossref pmid
8. Vestbo J, Hurd SS, Agusti AG, Jones PW, Vogelmeier C, Anzueto A, et al. Global strategy for the diagnosis, management, and prevention of chronic obstructive pulmonary disease: GOLD executive summary. Am J Respir Crit Care Med 2013;187:347-65.
crossref pmid
9. Graham BL, Steenbruggen I, Miller MR, Barjaktarevic IZ, Cooper BG, Hall GL, et al. Standardization of spirometry 2019 update: an official American Thoracic Society and European Respiratory Society Technical Statement. Am J Respir Crit Care Med 2019;200:e70-88.
crossref pmid pmc
10. Vestbo J, Anderson W, Coxson HO, Crim C, Dawber F, Edwards L, et al. Evaluation of COPD longitudinally to identify predictive surrogate end-points (ECLIPSE). Eur Respir J 2008;31:869-73.
crossref pmid
11. Liu C, Cheng W, Zeng Y, Zhou Z, Zhao Y, Duan J, et al. Different characteristics of ex-smokers and current smokers with COPD: a cross-sectional study in China. Int J Chron Obstruct Pulmon Dis 2020;15:1613-19.
pmid pmc
12. Mesquita R, Goncalves CG, Hayashi D, Costa Vde S, Teixeira Dde C, de Freitas ER, et al. Smoking status and its relationship with exercise capacity, physical activity in daily life and quality of life in physically independent, elderly individuals. Physiotherapy 2015;101:55-61.
crossref pmid
13. Caram LM, Ferrari R, Bertani AL, Garcia T, Mesquita CB, Knaut C, et al. Smoking and early COPD as independent predictors of body composition, exercise capacity, and health status. PLoS One 2016;11:e0164290.
crossref pmid pmc
14. Saetia M, Puangprachang K, Semanu P, Siaosirithaworn S. Effects of 6 minute walk test and lung function test between smoking and stop smoking in chronic obstruction pulmonary disease patients at Samut Songkhram. Tob Induc Dis 2021;19:A17.
crossref
15. Kim Y, Kim SH, Rhee CK, Lee JS, Lee CY, Kim DK, et al. Air trapping and the risk of COPD exacerbation: analysis from prospective KOCOSS Cohort. Front Med (Lausanne) 2022;9:835069.
crossref pmid pmc
16. Ferrari M, Manea L, Anton K, Bruzzone P, Meneghello M, Zamboni F, et al. Anemia and hemoglobin serum levels are associated with exercise capacity and quality of life in chronic obstructive pulmonary disease. BMC Pulm Med 2015;15:58.
crossref pmid pmc pdf
17. Cote C, Zilberberg MD, Mody SH, Dordelly LJ, Celli B. Haemoglobin level and its clinical impact in a cohort of patients with COPD. Eur Respir J 2007;29:923-9.
crossref pmid
18. Santer P, McGahey A, Frise MC, Petousi N, Talbot NP, Baskerville R, et al. Intravenous iron and chronic obstructive pulmonary disease: a randomised controlled trial. BMJ Open Respir Res 2020;7:e000577.
crossref pmid pmc
19. Fujimoto H, Asai K, Watanabe T, Kanazawa H, Hirata K. Association of six-minute walk distance (6MWD) with resting pulmonary function in patients with chronic obstructive pulmonary disease (COPD). Osaka City Med J 2011;57:21-9.
pmid
20. Diaz AA, Pinto-Plata V, Hernandez C, Pena J, Ramos C, Diaz JC, et al. Emphysema and DLCO predict a clinically important difference for 6MWD decline in COPD. Respir Med 2015;109:882-9.
crossref pmid


ABOUT
ARTICLE & TOPICS
Article category

Browse all articles >

Topics

Browse all articles >

BROWSE ARTICLES
FOR CONTRIBUTORS
Editorial Office
101-605, 58, Banpo-daero, Seocho-gu (Seocho-dong, Seocho Art-Xi), Seoul 06652, Korea
Tel: +82-2-575-3825, +82-2-576-5347    Fax: +82-2-572-6683    E-mail: katrdsubmit@lungkorea.org                

Copyright © 2024 by The Korean Academy of Tuberculosis and Respiratory Diseases. All rights reserved.

Developed in M2PI

Close layer
prev next