


Introduction
Chronic obstructive pulmonary disease (COPD) represents a common, preventable, and treatable illness with chronic respiratory symptoms and limited airflow because of airway and/or alveolar abnormalities. It often results from being significantly exposed to harmful gases or particles. COPD is related to high morbidity, mortality, and increased economic and social problems worldwide [1]. Patients with COPD have diaphragmatic dysfunction and weakness due to different causes, including over-inflation of the lungs, remodeling, and oxidative stress, as well as reduced myosin filament, because of the reduction in the production of protein, and increase in the apoptosis of muscle cells [2].
The literature on the weakness of inspiratory muscles in patients with COPD always addresses the diaphragm as the main source of tidal volume [3]. The diaphragmatic dysfunction relates to altered pulmonary function parameters, e.g., forced expiratory volume in 1 second (FEV1) [4]. Diaphragmatic weakness is detected by below normal amplitude excursion on deep breathing, with or without paradoxical motion on sniffing [5].
There are many methods of evaluation of the diaphragmatic function, such as trans-diaphragmatic pressure measurements, which are considered the key rule of diagnosis [6,7]. In 1975, Haber et al. [8] introduced M- and B-mode ultrasonography (US) to evaluate diaphragm movement. This measurement was considered to be a quick, simple, and accessible evaluation, as well as a non-ionizing one [9]. Traditional ultrasound in the frequency range 2 to 10 MHz is used to evaluate and differentiate COPD from other mimicking conditions, based on observing the diaphragmatic function and air trapping, as well as A lines [10].
This work aims to explore the clinical usefulness of chest ultrasound in the evaluation of stable COPD patients and those in exacerbation, with a focus on diaphragmatic measurements, and to determine any correlation with spirometry parameters and other clinical parameters.
Materials and Methods
1. Study design and setting
The present prospective, case-control study recruited 100 cases diagnosed with COPD, and admitted to ward and/or attending our outpatient clinic in tertiary care hospital, in the period June 2021 to February 2022.
2. Sample size
The study population was classified into the following groups: group (1) patients with stable COPD, numbering 40; group (2) patients with COPD exacerbation, numbering 60; and 20 aged-matched healthy controls. COPD patients were classified based on the Global Initiative for Chronic Obstructive Lung Disease (GOLD) 2020 classification into four groups: GOLD A, GOLD B, GOLD C, and GOLD D. While groups A and B included low-risk cases, groups C and D included high-risk ones. An exacerbation of chronic obstructive pulmonary disease (ECOPD) was defined as ŌĆ£an acute event that is characterized by a worsening of the patientŌĆÖs respiratory symptoms that is beyond normal day-to-day variations, and that leads to a change in medication.ŌĆØ An ECOPD is characterized by increased dyspnea, and increased sputum purulence and volume, together with increased coughs and wheezes, and is often associated with increased local and systemic inflammation caused by infection, pollution, or other insult to the airways.
3. Data collection method
The study included all patients with confirmed COPD diagnosis by clinical evaluation together with post bronchodilator spirometry, FEV1/forced volume capacity (FVC) <70%, and presented to our department during the period of the study. It excluded patients with clinical and/or radiographic evidence of other chest diseases, apart from COPD. Patients with cardiogenic pulmonary edema were also excluded. All studied subjects (cases and controls) were subjected to: taking history (including respiratory symptoms, such as cough and exertional dyspnea, as well as chest pain), clinical examination and radiological evaluation, including chest radiograph, and high-resolution computed tomography (CT) scanning of the chest, as well as echocardiography, if needed.
US was performed for all patients. The machine used in the study was Medison SonoAceR3 (Samsung, Seoul, Korea) ultrasound system with 2 to 8 MHz curvilinear and 5 to 12 MHz linear probes. The same operator performed the chest US on all the study population. Cases were examined by oblique and longitudinal scans on both the posterior and anterior chest in the seated and supine positions by high- and low-frequency probes, application of ultrasound gel on the selected probe, positioning of the probe on the chest wall perpendicular to the skin with the probe marker pointing to the patientŌĆÖs head, while the image marker on the screen corresponded to the probe marker, and was positioned to the right of the screen.
To analyze data, each hemithorax was divided into six regions delineated by the anterior and posterior axillary lines, three in the upper fields (anterior, posterior, and lateral), and the other three in the lower fields (anterior, posterior, and lateral). The sonographic finding includes B-lines, pneumothorax, and lung consolidation (which was indicated by air bronchogram, fluid bronchogram, or shred sign), lung abscess; pleural effusion; pulmonary infarction; and lung mass.
2) Diaphragm thickness
The thickness of the diaphragm muscle at deep inspiration was evaluated by B-mode US (Supplementary Figure S1A).
3) Technique of examination
All participants underwent B-mode US examinations in the supine position. Probe was placed between the anterior and the mid axillary lines in the 9th intercostal space perpendicular to two ribs (9thŌłÆ10th). The diaphragm muscle appears as hypoechoic lines between two parallel echoic lines, i.e., the peritoneal membrane and diaphragmatic pleura. The patient was advised to take spontaneous breathing and deep inspiration. Thickness was evaluated by putting the calipers inside the hyperechoic lines, three diaphragmatic thickness measurements of the right diaphragm were taken for each patient, and the best value was registered (Supplementary Figure S1A) [13].
4) Diaphragm excursion
This is the movement of the diaphragm during breathing. The normal diaphragmatic excursion should be 3 to 5 cm.
5) Technique of examination
The participants were scanned based on a low anterior subcostal approach and/or a coronal intercostal approach. The two-dimensional mode was utilized to define the best approach, and choose the exploration line. The M-mode line of sight was angled to obtain the highest diaphragmatic excursion. M-mode was used to measure the diaphragmatic excursion during deep inspiration at the right hemidiaphragm. The liver was employed as a window. The distance between echogenic lines was evaluated on frozen images from the M-mode. Calipers were centered on the echogenic lines. For each patient, three measurements were carried out, recording the best value. All diaphragmatic excursion measurements were given in centimeters (Supplementary Figure S1B, C) [14].
4. Statistical analysis
The authors carried out statistical analysis using SPSS for Windows version 21 (IBM Corp., Armonk, NY, USA). Median, standard deviation, mean, and interquartile range represented the quantitative data. Moreover, the Shapiro-Wilk test was used to test data for normality. The Student t-test was used to compare the means of two groups, while analysis of variance (ANOVA) was used for more than two groups. When the data were not normally distributed, the Mann-Whitney test was used to compare the means of two groups, and the Kruskal-Wallis Test was employed to compare the means of different groups. Qualitative data were shown in the form of number and percentage. Comparison of data was carried out using either the chi-square test or FisherŌĆÖs exact test. McNemarŌĆÖs test was used to compare the results of the different methods used for the diagnosis of lung pathology. PearsonŌĆÖs correlation coefficient was adopted to evaluate the association between diaphragmatic measurements and quantitative data, while SpearmanŌĆÖs correlation coefficient test was used to evaluate the association between diaphragmatic measurements and qualitative data. By analyzing the receiver operating characteristic curve, we could obtain the accuracy, specificity, and sensitivity of the chest ultrasound. Graphs were created using Excel (Microsoft, Redmond, WA, USA) or SPSS. A p-value was significant if it was below 0.05.
5. Data availability statement
The authors confirm that all data supporting the findings of this study are available within the article, its supplementary material, and upon reasonable request.
6. Ethics approval statement
The Research Ethics Committee of the Faculty of Medicine Sohag University approved the study design (IRB registration number: Soh-Med-22-10-0013006). The study was conducted by adhering to the principles of the 1964 Declaration of Helsinki and its 2013 amendment. In accordance with the Declaration of Helsinki, all patients provided their informed consent after proper counselling before participation in the study.
Results
This paper studied 60 cases with COPD exacerbation, 40 with stable COPD, and 20 healthy controls of the same age group. The mean age of the study population was 61.55┬▒6.92 years. No statistically significant differences were found in the two groups by gender, or by age (p=0.342, p=0.220, respectively). Significantly higher percentage of the exacerbated group were current smoker than of the stable COPD (p<0.0001). There was a highly significant relationship between COPD exacerbation and moderate to severe grades of smoking index (p<0.0001) (Table 1).
Supplementary Tables S1, S2 present patient characteristics as regard gasometric parameters, pulmonary function, and echocardiographic finding. Ultrasound evaluation revealed that multiple A lines (more than 3) were more frequently found in COPD exacerbation than in stable patients, while the same as found for B-lines. The difference showed statistical significance (p=0.008 and p<0.0001, respectively) (Table 2). Table 3 shows other sonographic findings in both groups.
The diagnostic validity of chest ultrasound was assessed in comparison with CT as the gold standard. TUS significantly showed high specificity, negative predictive value, positive predictive value, and accuracy in detecting pleural effusion, consolidation, and pneumothorax, as well as lung mass. Sensitivity values were lower. In the detection of emphysematous bullae, the sensitivity was very low (18.18%) (Table 4).
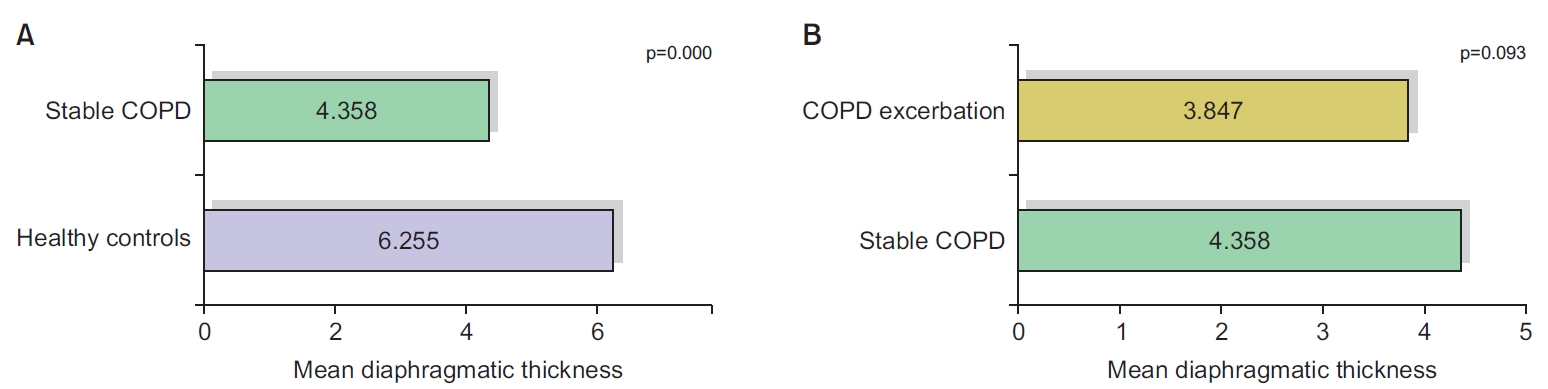
Diaphragmatic measurements showed that the mean value of the diaphragmatic thickness and the diaphragmatic excursion decreased significantly in stable COPD patients, compared to healthy controls. The difference between stable and exacerbated COPD was statistically insignificant (Figures 1, 2).
In terms of correlation between diaphragmatic measurements (thickness and excursion), and COPD patientŌĆÖs characteristics, diaphragmatic thickness showed a statistically significant negative correlation with body mass index (BMI) and dyspnea grades (r=ŌłÆ0.300, r=ŌłÆ0.274, p=0.014, p=0.00016, respectively), while diaphragmatic excursion displayed a statistically significant negative correlation with the frequency of exacerbation, BMI, and dyspnea grades (p=0.003, p<0.001, p=0.012, respectively). No statistically significant correlation of diaphragmatic measurements (thickness or excursion) was reported with age (Table 5).
Concerning the correlation between diaphragmatic measurements (thickness and excursion), and spirometric results of COPD patients, PearsonŌĆÖs correlation analysis showed that diaphragmatic thickness and excursion had a significant positive correlation with spirometric measures, including FEV1 and FVC (Table 6 and Supplementary Figures S2, S3).
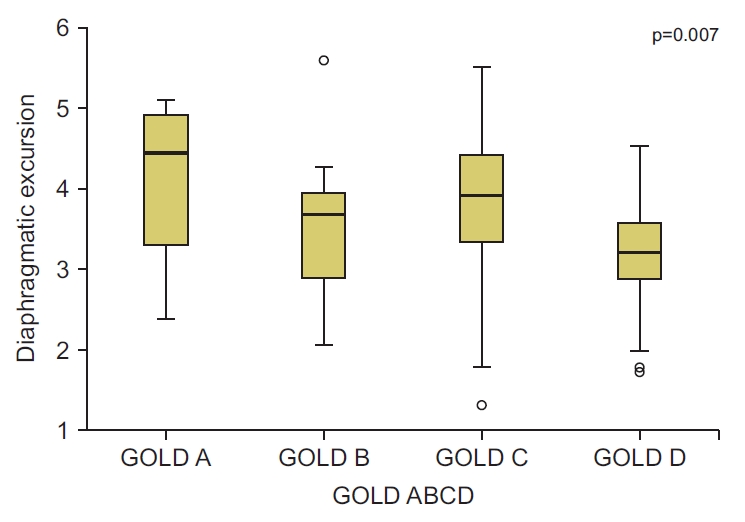
The assessment of diaphragmatic thickness in different GOLD groups revealed that the mean value of diaphragmatic thickness was higher in the low-risk groups (GOLD A, B) than the high-risk groups (GOLD C, D) of COPD patients, although the difference was not statistically significant (p=0.09) (Table 7). Comparison of diaphragmatic excursion among different GOLD groups showed no statistically significant differences in diaphragmatic excursion among the different GOLD groups. Diaphragmatic excursion decreased toward group D (Figure 3).
Ultrasonographic findings in different GOLD groups showed that there was a significant difference between GOLD groups in some sonographic findings. Multiple A and B-lines were significantly more in the GOLD group D (p=0.01, p=0.001 respectively). Also, significantly more pleural effusion was detected in patients with high symptom severity and high-risk (GOLD D), than other groups of patients (p=0.001). The analysis of pleural effusion was found to be related to right ventricular failure. No statistically significant differences of the other US findings were reported among patients in the different GOLD groups (Table 8).
Discussion
COPD represents the fourth primary reason for mortality worldwide, denoting a major public health issue [15]. COPD exacerbation causes changes in airway caliber and hyperinflation in the parenchyma [16. Researchers have introduced US to provide tools for the facile, accessible, quick, as well as non-ionizing evaluation of several physiological variables, such as diaphragm function and integrity [3]. This work aimed to evaluate the clinical utility of chest US in stable and exacerbated COPD patients with attention paid to diaphragm thickness and excursion.
Here, the mean age of the study population was 61.55┬▒6.92 years. COPD exacerbation was highly related to smoking state and smoking index. Those findings matched the results of Dong et al. [17], who found that both old age and high smoking index are risks for COPD exacerbation, which can be attributed to lung dysfunction with age [18]. On ultrasound examinations of the lung, the detection of prominent A lines at the lateral and anterior surfaces of the lung is indicative of exacerbation [19].
In our study, multiple A lines were significantly more frequent in the exacerbation group. This finding matched the findings of Youssuf et al. [20], who showed that prominent A lines were detected in 60% of the total COPD patients. This result was attributed to more prominent hyperinflation, which explained this finding during exacerbation [21]. B-lines become evident when the lung parenchymal air content is partially reduced, and/or the interstitial space is volumetrically increased, as is the case in interstitial lung disease [22].
In the current study, we reported that 24 cases (24%) showed one or two B-lines, while eight cases (8%) showed more than three B-lines. In the same context, we also reported statistically significant differences between the stable COPD group and the exacerbation group. In agreement with this finding, Sriram and Singh [23] on performing lung ultrasound, observed B-lines in cases with COPD exacerbations. Acute respiratory distress, interstitial lung disease, or subclinical heart failure were the proposed aetiologies [24].
In our study, the diagnostic validity of chest ultrasound compared to CT as the key standard in detecting pleural effusion and consolidation showed an accuracy of 94% and 91%, respectively, with p<0.0001 for both. Those findings matched with the results of Elnaem et al. [25], who diagnosed pleural effusion and consolidation by TUS with an accuracy of 97.8% and 96.7%, respectively. Transthoracic ultrasound is an outstanding diagnostic tool of community-acquired pneumonia, as a common cause of consolidation, with excellent sensitivity and specificity. It is widely available and simple, with no ionizing radiation [26]. According to Agmy et al. [27], this tool offers much better sensitivity, specificity, and accuracy than chest X-ray in the diagnosis of most chest pathology, such as pleural effusion, pneumothorax, consolidation, and interstitial lung syndrome.
We conducted a diagnosis of four cases with pneumothorax by CT chest as the best standard. Ultrasound detected pneumothorax in three cases with perfect agreement with final diagnosis with 75% sensitivity and 100% specificity, as well as a diagnostic accuracy of 99%. In accordance with our results, Lichtenstein et al. [28] found that ultrasound demonstrated a sensitivity of 79% and a specificity of 100% in diagnosing pneumothorax.
Here, we compared the mean value of diaphragmatic thickness and excursion between healthy controls and the stable COPD group, and observed a highly significant correlation between the presence of COPD and the reduction in diaphragmatic thickness and excursion. Following our results, multiple studies showed similar findings. For example, Essawy and Al-Arag [29] and Paulin et al. [30] showed a statistically significant difference between the control group and the group with COPD, as regards diaphragmatic thickness, diaphragmatic thickness fraction, and excursion.
Furthermore, Gerscovich et al. [31] illustrated the accuracy of ultrasound in evaluating the diaphragm motion, because this method did not have any technical failures, and proved easy to utilize. It should be the best technique to examine the diaphragm motion. The reduction of diaphragm thickness and excursion in COPD could be explained by the restriction of peripheral airflow that increasingly traps gas in the expiration, which causes hyperinflation. This static hyperinflation declines the inspiratory capacity, which causes higher dyspnea and limited exercise capacity. Also, it results in deterioration of the diaphragmŌĆÖs contractile property [32].
The present study showed that diaphragmatic measurements (thickness and excursion) had a significant negative correlation with BMI and the modified Medical Research Council (mMRC) dyspnea scale. Also, we found a significant negative relationship between the frequency of COPD exacerbation and diaphragmatic excursion. The prevention of exacerbation is a fundamental goal in COPD management. In this regard, several previous studies reported that the patients who had lower diaphragmatic mobility had more dyspneic and shorter 6 minutes walk distances [33]. Smargiassi et al. [34] reported a direct significant correlation between diaphragmatic excursion and BMI only.
Unlike our results, Ogan et al. [35] and Yalcin et al. [36] reported the lack of correlations between diaphragmatic thickness and frequency of exacerbations, BMI, and symptom score based on mMRC. The present work found that diaphragmatic thickness and excursion had a significant positive correlation with spirometry measures, including FEV1 and FVC. These results correlated with those of Lim et al. [37], who reported a significant correlation between diaphragmatic thickness and FEV1 percentage, but no correlation between diaphragm excursion and FEV1 percentage. Similarly, Yalcin et al. [36] and Shiraishi et al. [38] reported that diaphragmatic excursion was significantly lower in COPD patients with low FEV1 values.
In the current study, based on the classification of our patients according to the GOLD ABCD categorization tool, we found that the mean value of diaphragmatic thickness and excursion were significantly declined with risk progression from group A subgroup up to subgroup D. This result matched Essawy and Al-Arag [29] who assessed the diaphragmatic function in each COPD subgroup, and diaphragmatic thickness. The diaphragmatic thickness fraction among COPD subgroups A, B, C, and D showed significant reduction of each parameter toward the groups with more frequent exacerbation. The recently issued GOLD report replaced groups C and D with one E (exacerbated) group. This reflects the prognostic effect of exacerbation in COPD patients.
The present paper is an addition to the literature on the clinical significance of transthoracic sonographic evaluation of COPD patients in both stable and exacerbated conditions. The assessment of diaphragmatic excursions and thickness by TUS in patients with COPD and their correlations with disease-related factors proved informative, and paves the way for better management of COPD patients. We recommend that future research includes the follow-up of COPD patients after implementing rehabilitation and other therapeutic options using TUS.
In conclusion, because the diaphragm is a powerful inspiratory muscle, its impaired functioning greatly influences the deterioration of respiratory functioning in patients with COPD. TUS measurements of diaphragm excursion and thickness in COPD patients in consortium with the detection of other findings during TUS evaluation may play a pivotal role in managing COPD patients.

 PDF Links
 PubReader
 ePub Link
 Data Sharing Statement
 Full text via DOI
 Supplement1
 Print
Print Download Citation